Thu, Jan 29, 2026
Volume 11, Issue 3 (Summer 2025)
Caspian J Neurol Sci 2025, 11(3): 213-222 |
Back to browse issues page


Ethics code: We have used a publicly available dataset to validate our proposed algorithm, hence we don’t have
Download citation:
BibTeX | RIS | EndNote | Medlars | ProCite | Reference Manager | RefWorks
Send citation to:


BibTeX | RIS | EndNote | Medlars | ProCite | Reference Manager | RefWorks
Send citation to:
Ghavami D, Radman M, Chaibakhsh A. Optimized Time-domain Feature Extraction for Early Onset Diagnosis of Parkinson Disease From EEG Signals. Caspian J Neurol Sci 2025; 11 (3) :213-222
URL: http://cjns.gums.ac.ir/article-1-784-en.html
URL: http://cjns.gums.ac.ir/article-1-784-en.html


1- Faculty of Mechanical Engineering, University of Guilan, Rasht, Iran.
2- Brain-Computer Interfacing and Neural Engineering Laboratory, School of Computer Science and Electronic Engineering, Colchester, England.
3- Intelligent Systems and Advanced Control Lab, Faculty of Mechanical Engineering, University of Guilan, Rasht, Iran. ,chaibakhsh@guilan.ac.ir
2- Brain-Computer Interfacing and Neural Engineering Laboratory, School of Computer Science and Electronic Engineering, Colchester, England.
3- Intelligent Systems and Advanced Control Lab, Faculty of Mechanical Engineering, University of Guilan, Rasht, Iran. ,
Full-Text [PDF 2687 kb]
(461 Downloads)
| Abstract (HTML) (662 Views)
Full-Text: (277 Views)
Introduction
Parkinson disease (PD) is classified as a neurological illness that progresses gradually and can be diagnosed through a combination of motor and non-motor symptoms [1]. In people over 60, the prevalence of PD is increasing, currently affecting approximately 1% of this population [2]. Neurological disorders are presently the leading cause of disability worldwide, and PD is considered the fastest-growing among them [3]. PD ranks as the second most prevalent neurodegenerative disorder and is marked by the permanent degeneration of dopamine-producing neurons [4]. Therefore, PD is classified as a neurological condition that progressively worsens over time. Among individuals affected by PD, the dopamine-producing neurons within the substantia nigra first exhibit functional decline before degenerating. This neuronal degeneration impairs the brain’s ability to control body movements. Symptoms include tremors, akinesia (absence of voluntary movement), bradykinesia (slowness of movement), and difficulties with walking and posture [5]. In the absence of clear motor symptoms, diagnosing the disease can be challenging. Therefore, computer-aided detection systems can automatically detect PD using electroencephalogram [6].
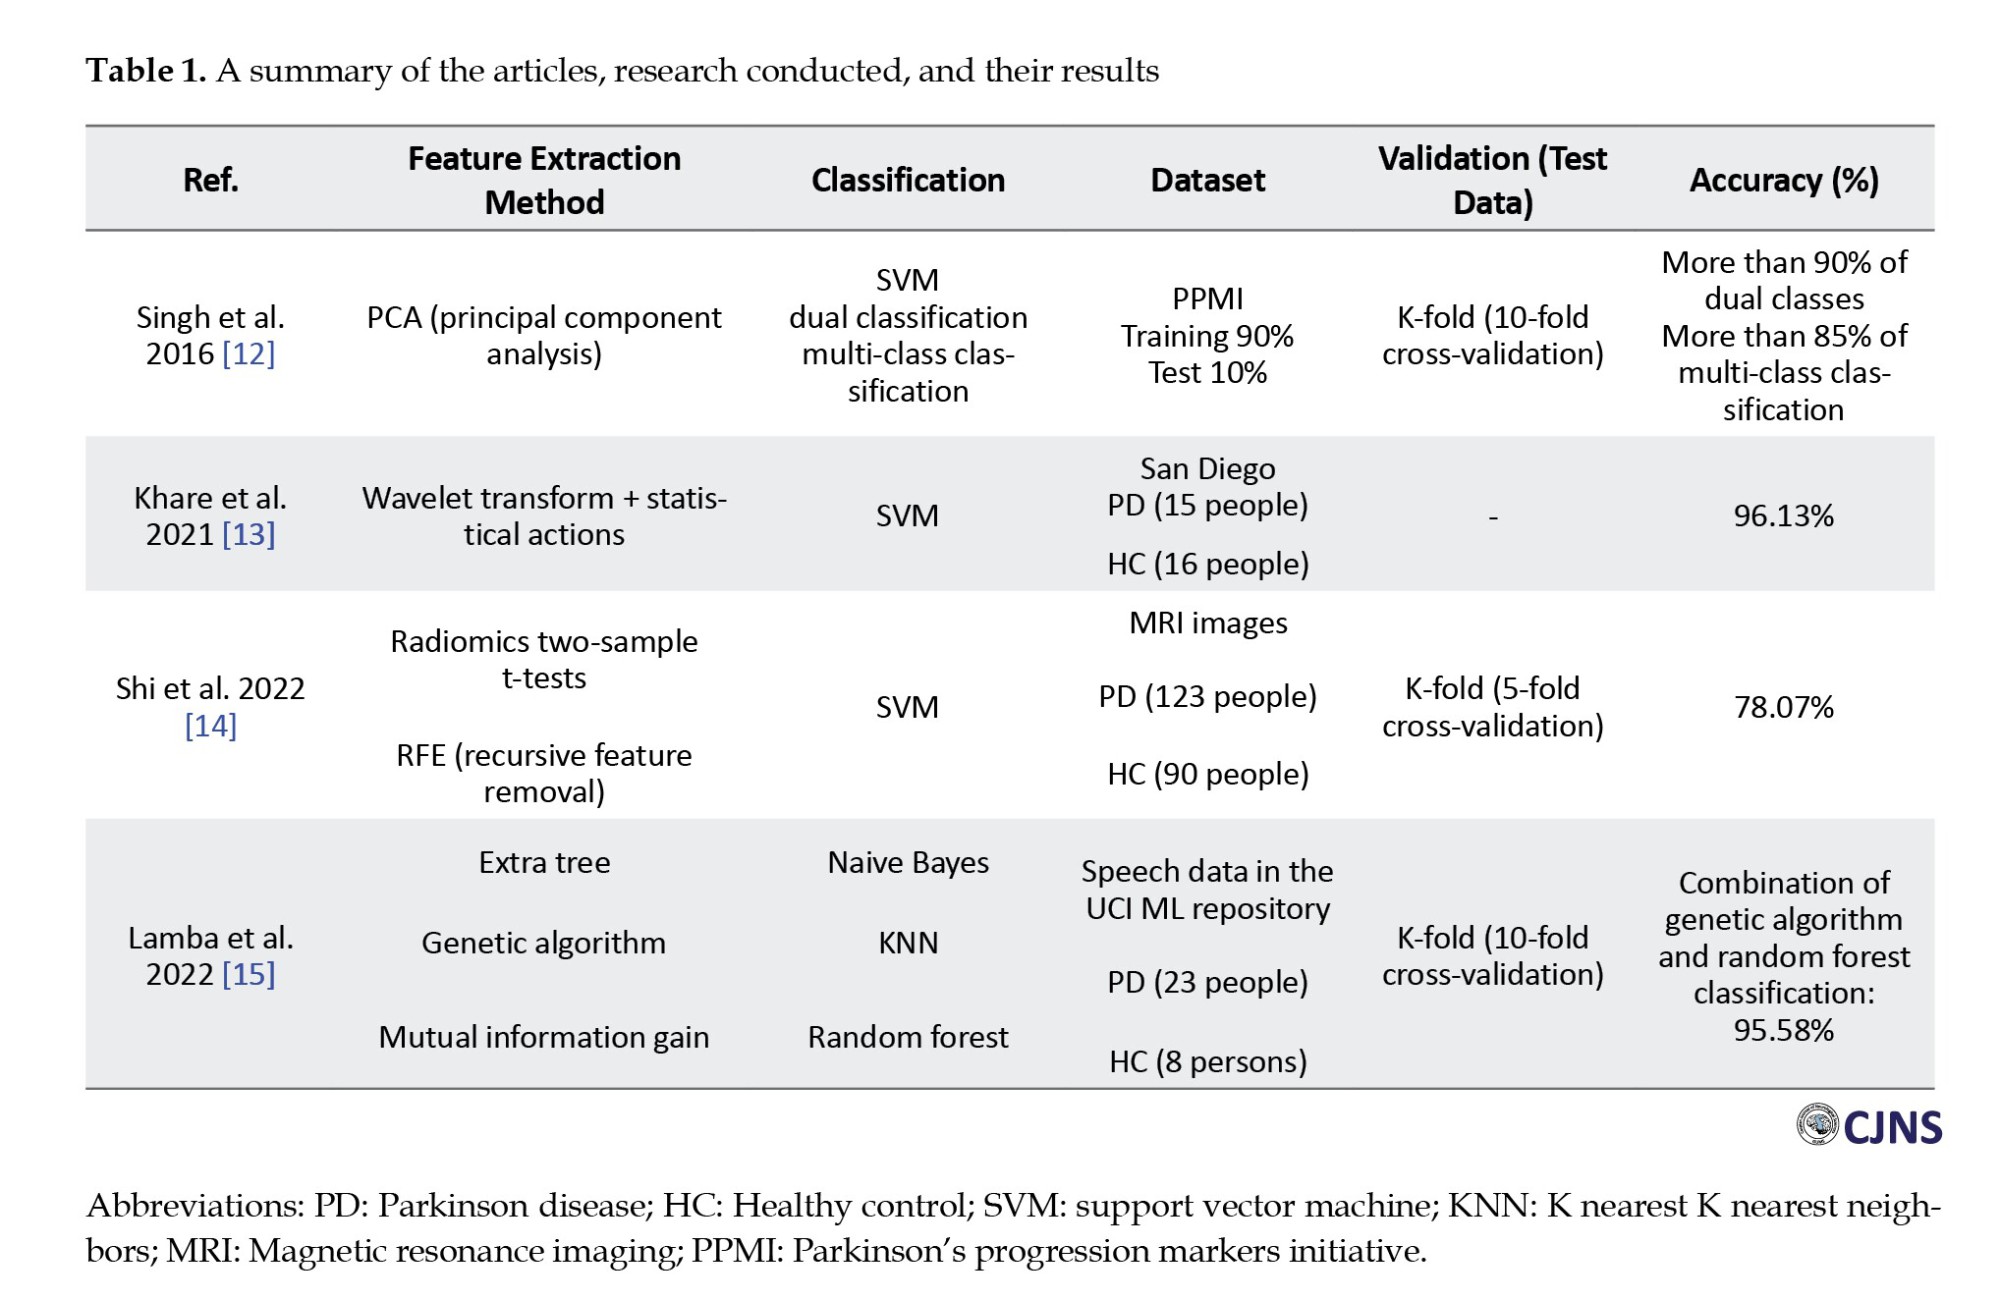
Given the challenges in the early diagnosis of PD and the progressive decline in motor control, numerous studies have focused on developing machine learning (ML)-based diagnostic methods. For instance, Aljalal et al. applied the discrete wavelet transform to analyze electroencephalography (EEG) signals from the San Diego and University of New Mexico (UNM) datasets in combination with various entropy-based measures. Subsequently, ML algorithms were used to differentiate patients with PD from healthy controls (HCs) [7].
Srikanth et al. employed a feature extraction method based on ensemble empirical mode decomposition (EMD) to enhance the accuracy of PD diagnosis. A range of ML and deep learning classification models were evaluated, with Convolutional Neural Networks (CNNs) yielding the highest accuracy of 98% [8]. Govindu and Palwe applied ML techniques to voice data features (MDVP 30) to classify patients with PD using a random forest model. This model was compared with support vector machine (SVM) and K nearest neighbors (KNN), and logistic regression classifiers, achieving an accuracy of 91.83% [9]. Hussain et al. used audio data to classify PD with SVM, random forest, and KNN models, validated through k-fold cross-validation. These studies emphasize the effectiveness of ML approaches in PD detection [10] .
Table 1 provides a summary of the related studies and their results. This study proposes a robust time-domain approach for PD detection. The method improves diagnostic performance using EEG-based brain signals by enhancing the feature extraction and feature selection stages within ML pipelines [11]. EEG signals are segmented using a windowing technique, and EMD is applied to extract intrinsic mode functions (IMFs). A nonlinear time series analysis method is applied to each IMF, and components with higher informational content are selected for feature extraction. These features are obtained from all EEG channels and used to train a decision tree classifier for final classification.
The proposed method was evaluated using the San Diego dataset, which demonstrated remarkable accuracy in classifying different conditions of patients with PD. The experimental results are analyzed and discussed in detail in this paper’s “results” and “discussion” sections.
Materials and Methods
The flowchart of the presented approach aimed at improving the performance of PD diagnosis based on brain signals is shown in Figure 1. Initially, The data are split into two distinct sets: One for training and the other for testing. A windowing technique is then utilized on the training data to divide it into smaller segments, where the window length significantly influences system performance.
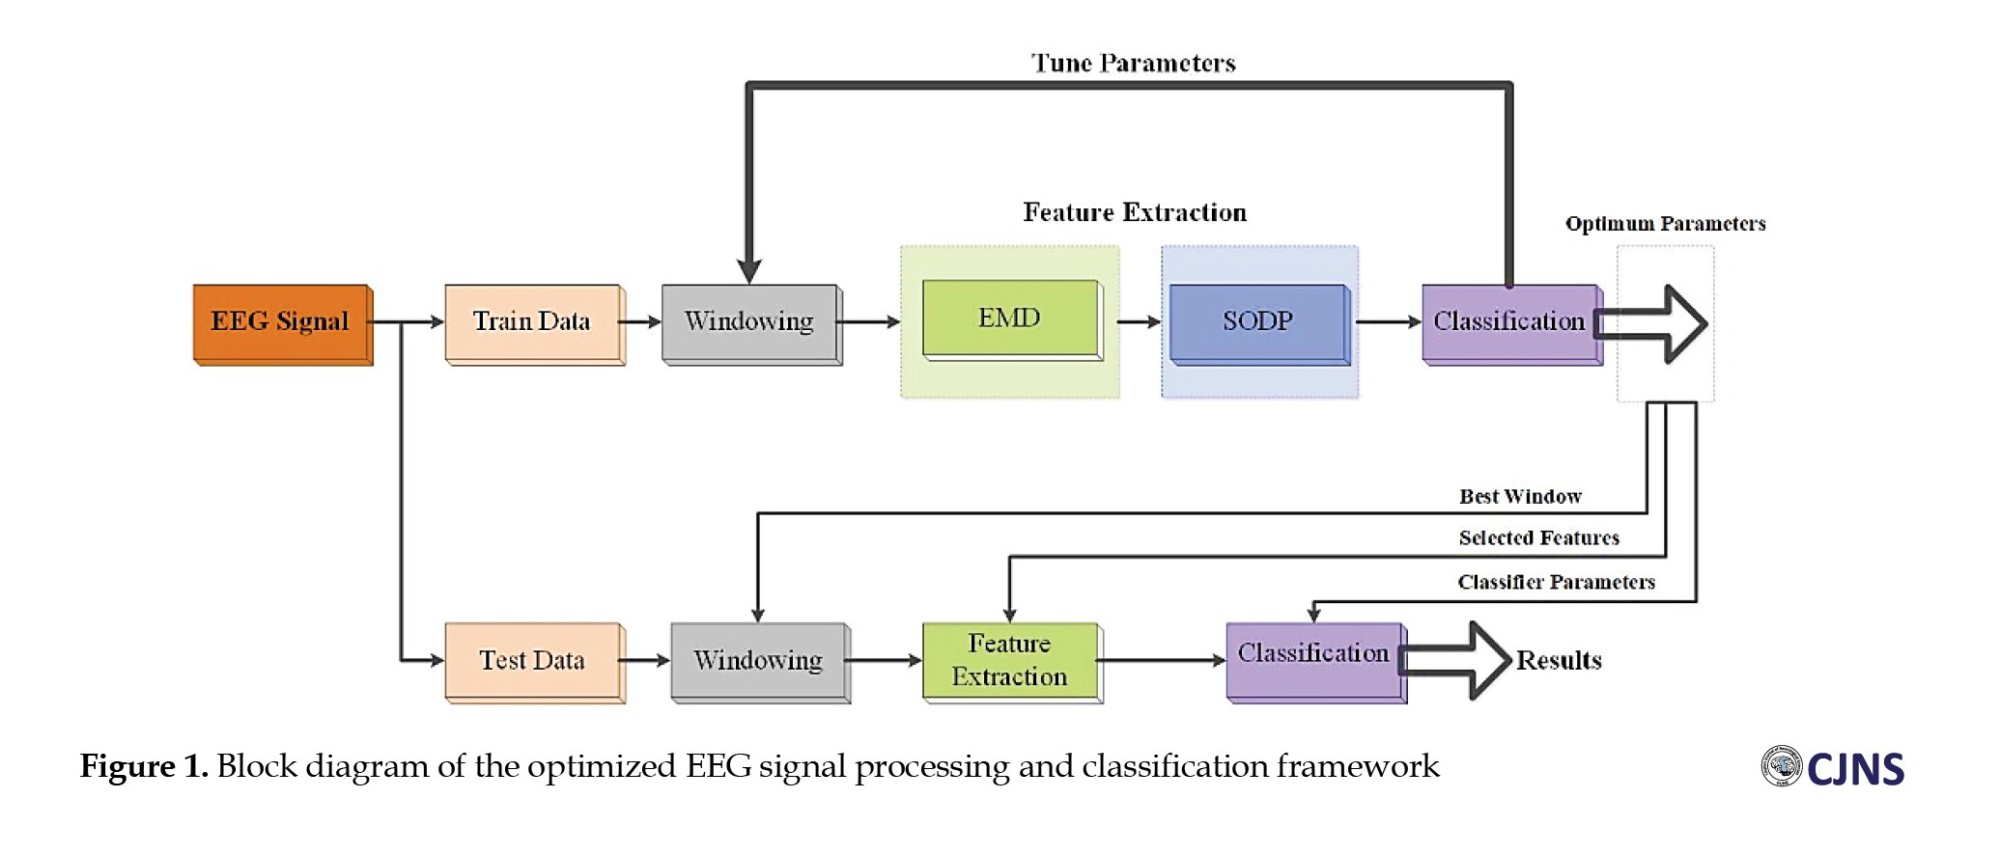
Following segmentation, EMD is applied to decompose the signal into multiple components. Subsequently, features are extracted from these segments using the second-order difference plot (SODP) method and are later employed to train the classifier. Once classification accuracy is obtained, the windowing parameters are assessed, and the window size yielding the best performance is selected.
Finally, the optimal parameters derived from the training phase are applied to the test data to evaluate the overall system performance. The following sections of this paper provide a detailed discussion of the dataset, methodology, and experimental results.
Dataset and pre-processing
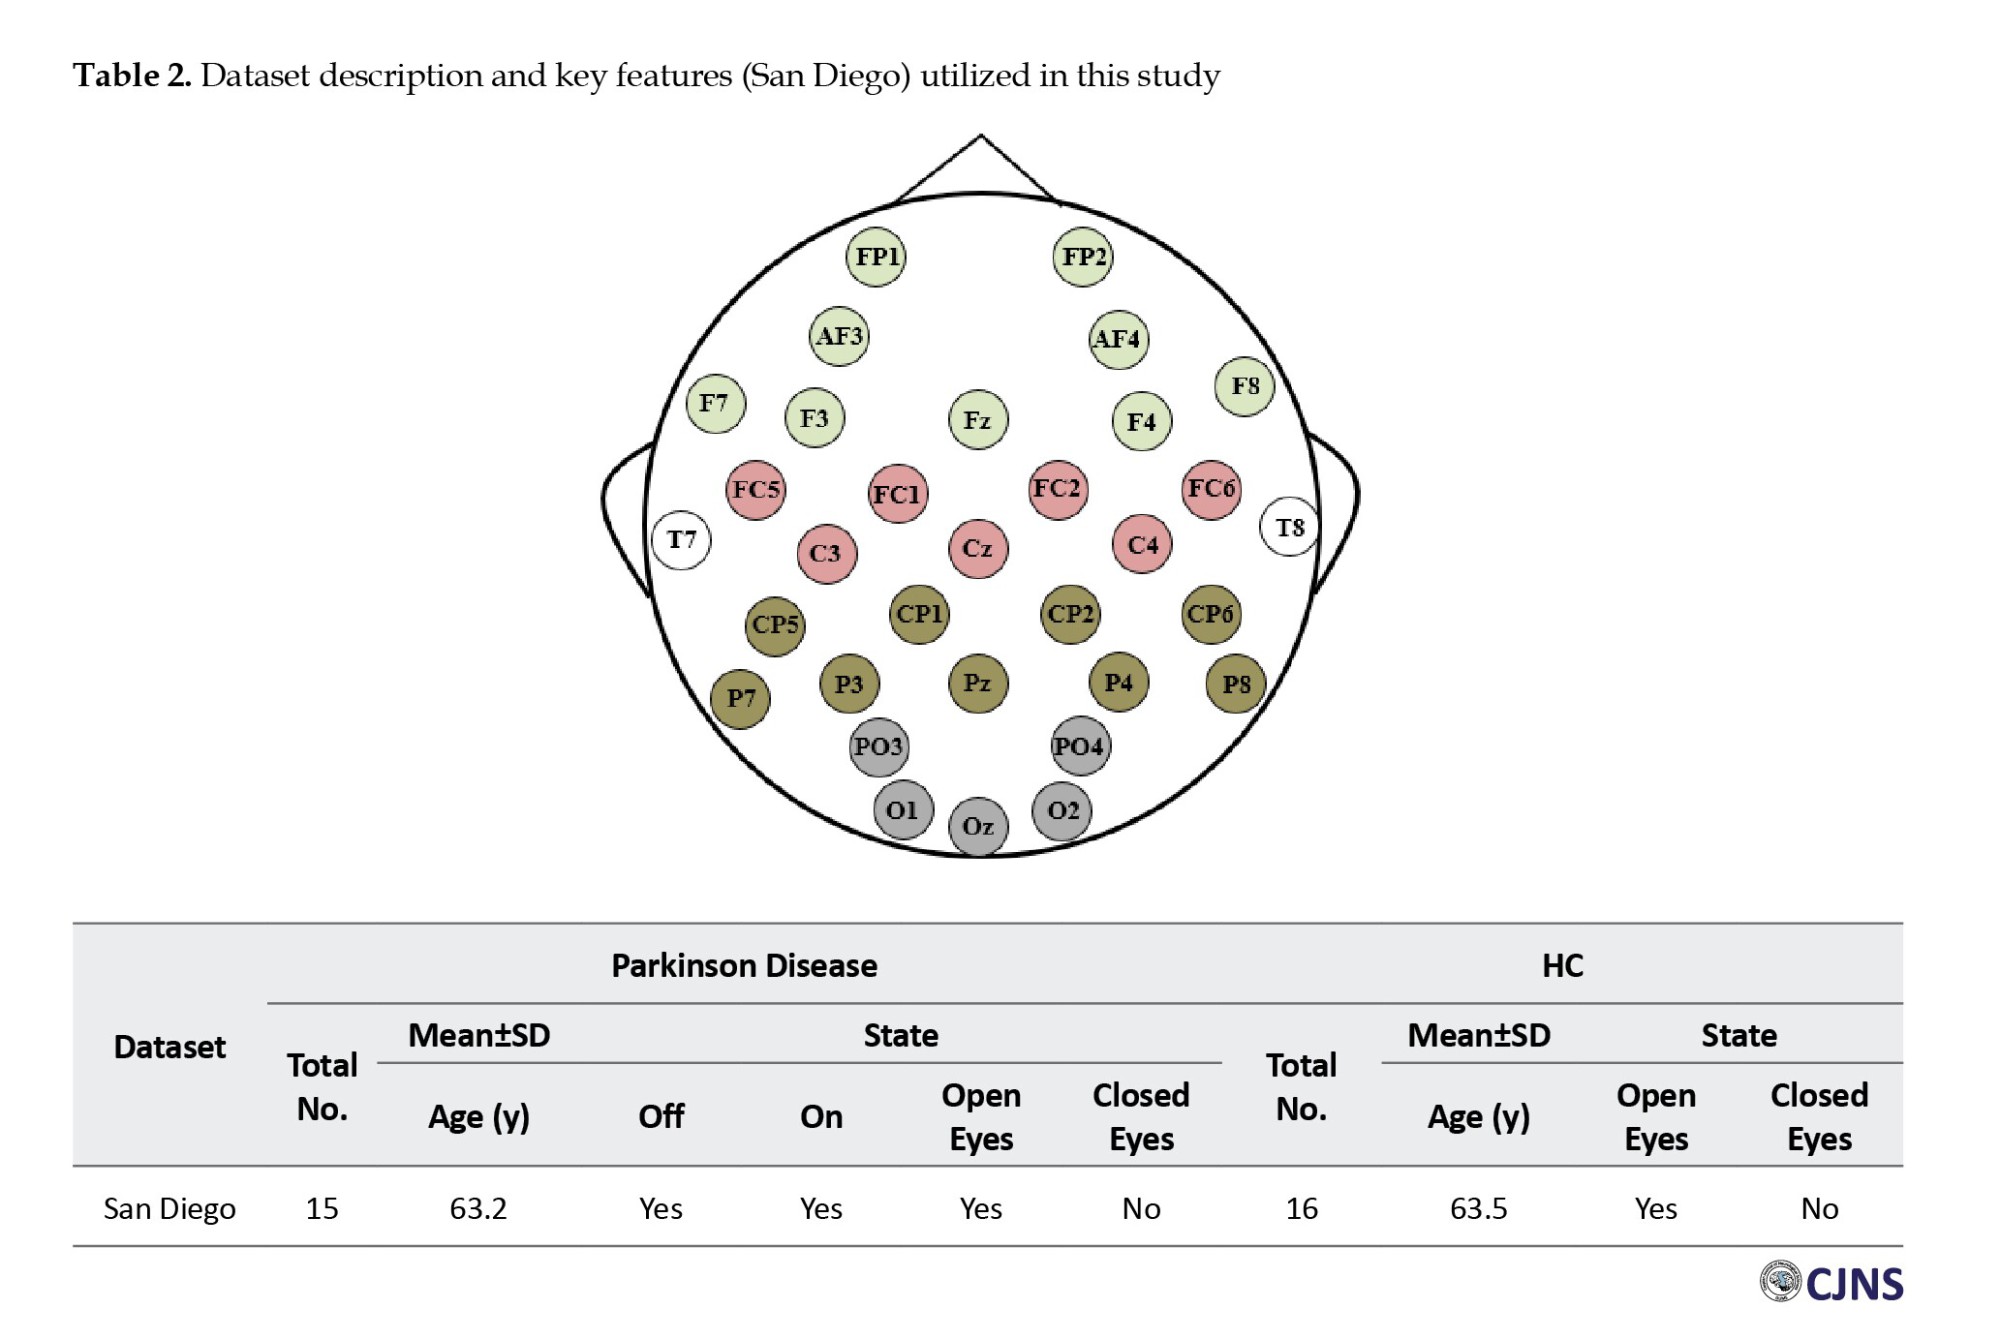
The method proposed in this study was evaluated using the San Diego dataset [16], which includes demographic and clinical information of the participants, as summarized in Table 2. EEG data were acquired using a 32-channel system over a minimum duration of three minutes, with a sampling rate of 512 Hz. The electrode placement used for EEG acquisition is presented in Table 2.
Feature extraction
EMD
EMD is a flexible technique for obtaining time-frequency information from a signal. It breaks down the signal into IMF components. The original signal is processed using a specialized technique known as the screening process to extract the IMFs [17-19]. Accordingly, the original signal is represented as illustrated in Equation 1:

An IMF refers to a numerical or analytical function that meets the following criteria:
a) The number of local extrema and zero crossings must be either equal or differ by no more than one,
b) The integral of the function over the defined time interval is zero, indicating that the mean of the envelope formed by the local maxima and the envelope formed by the local minima is zero at every point.
The extraction of IMFs, also known as the screening process, is an iterative procedure consisting of the following steps:
1) The local maxima and minima within the input signal x(t) are first detected.
2) The upper and lower envelopes are generated by interpolating through the local maxima and minima points, respectively.
3) The mean values of the upper and lower envelopes are computed using Equation 2.

4) Creating the first component of the signal according to Equation 3:

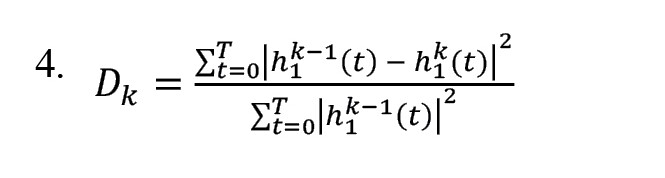
5) Investigating the conditions of the IMFs and measuring the stopping based on the Equation 4:
6) If condition 5 does not appear, replace the signal from stage 4 with the main signal and continue from stage 1.
7) If condition 6 is met, the screening process is over and is considered the first inherent mode function.
8) Suppose the remaining part satisfies the conditions of the IMFs. In that case, an IMF is considered, and in the absence of condition a, it is accepted as the initial signal, and steps 1 to 4 are repeated; otherwise, the equation [5] is considered as the remainder:

The above steps are performed times until IMF is obtained.
SODP
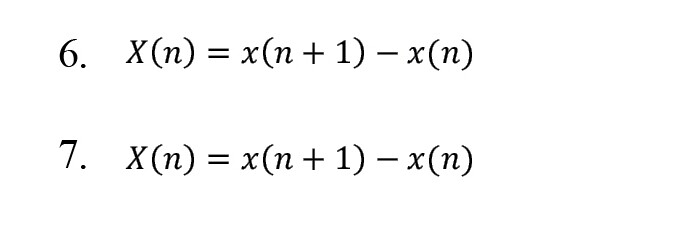
This method analyzes time series with nonlinear characteristics [20]. This method displays a graph of consecutive rates against each other. We can extract useful diagnostic information using the SODP of the IMFs of EEG signals [21]. In this part, the SODP diagram for plotting X(n) vs Y(n) is defined by the following equations:
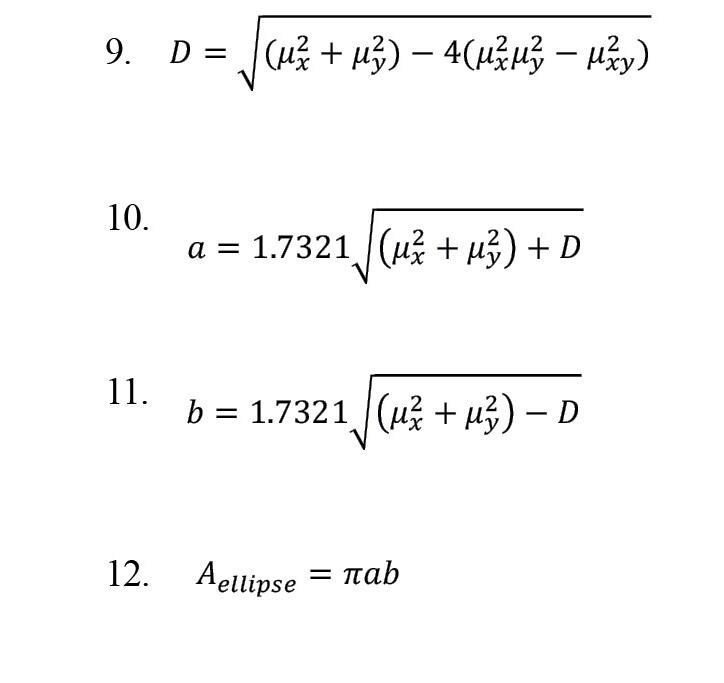
By using central tendency measurement, we can measure variability in this chart and, by reducing the sampling distance, appropriately scale the rates and get closer to continuous data results [22]. The SODP related to IMFs shows the EEG signals of elliptical shapes [21]. To determine the confidence region of SODP from IMFs, we use the following relationships:

The parameter and the area of the ellipse are calculated as follows:
Classification
Decision tree classifier
Decision trees are widely used in ML as an effective method for classifying and organizing data into distinct categories [23]. This approach relies on a hierarchical, tree-based structure, where each path originates from the root node and proceeds through a sequence of data splits until a binary decision is reached at a leaf node [24]. The core concept behind decision trees is to iteratively answer a series of binary (yes/no) questions to reach a classification outcome [25-27]. The Gini index and entropy are commonly used criteria for evaluating decision tree performance [28].
Decision trees are an effective tool in ML [23] used to classify and organize data into categories. This classification method employs a tree-based structure, where each path originates at the root node and follows a sequence of data-driven splits until a Boolean outcome is reached at a leaf node [24]. The main concept of the decision tree is to answer questions with yes or no options [25, 26].
Results
As illustrated in Figure 1, this study explores the effect of time window selection on feature extraction, aiming to determine the most appropriate window length for the dataset utilized. The analysis begins with an initial window length of 2 seconds. The EEG signals are processed within each window using EMD to extract their corresponding IMFs.
IMFs are crucial for signal analysis, as they represent intrinsic components of the signal across distinct frequency bands. Each IMF encapsulates localized oscillatory behavior that reflects the inherent characteristics of the original signal. Due to these properties, IMFs are particularly effective in analyzing complex and nonlinear signal patterns.
Moreover, IMFs facilitate extracting meaningful information from signals, support the analysis of temporal dynamics, and contribute to noise reduction and anomaly detection. In this study, the extracted IMFs are integral to evaluating the influence of time window selection on signal analysis and improving the accuracy of feature extraction.
Figure 2 illustrates a segment of the EEG signal from a single channel alongside its corresponding IMFs. The next step involves extracting features from the first three IMFs selected for this analysis based on their relevance to the signal's dominant oscillatory components. The SODPs of these IMFs, also shown in Figure 2, reveal elliptical patterns. These elliptical shapes emerge from strong correlations between successive data points within the initial IMFs, indicating consistent temporal structure in the underlying signal.
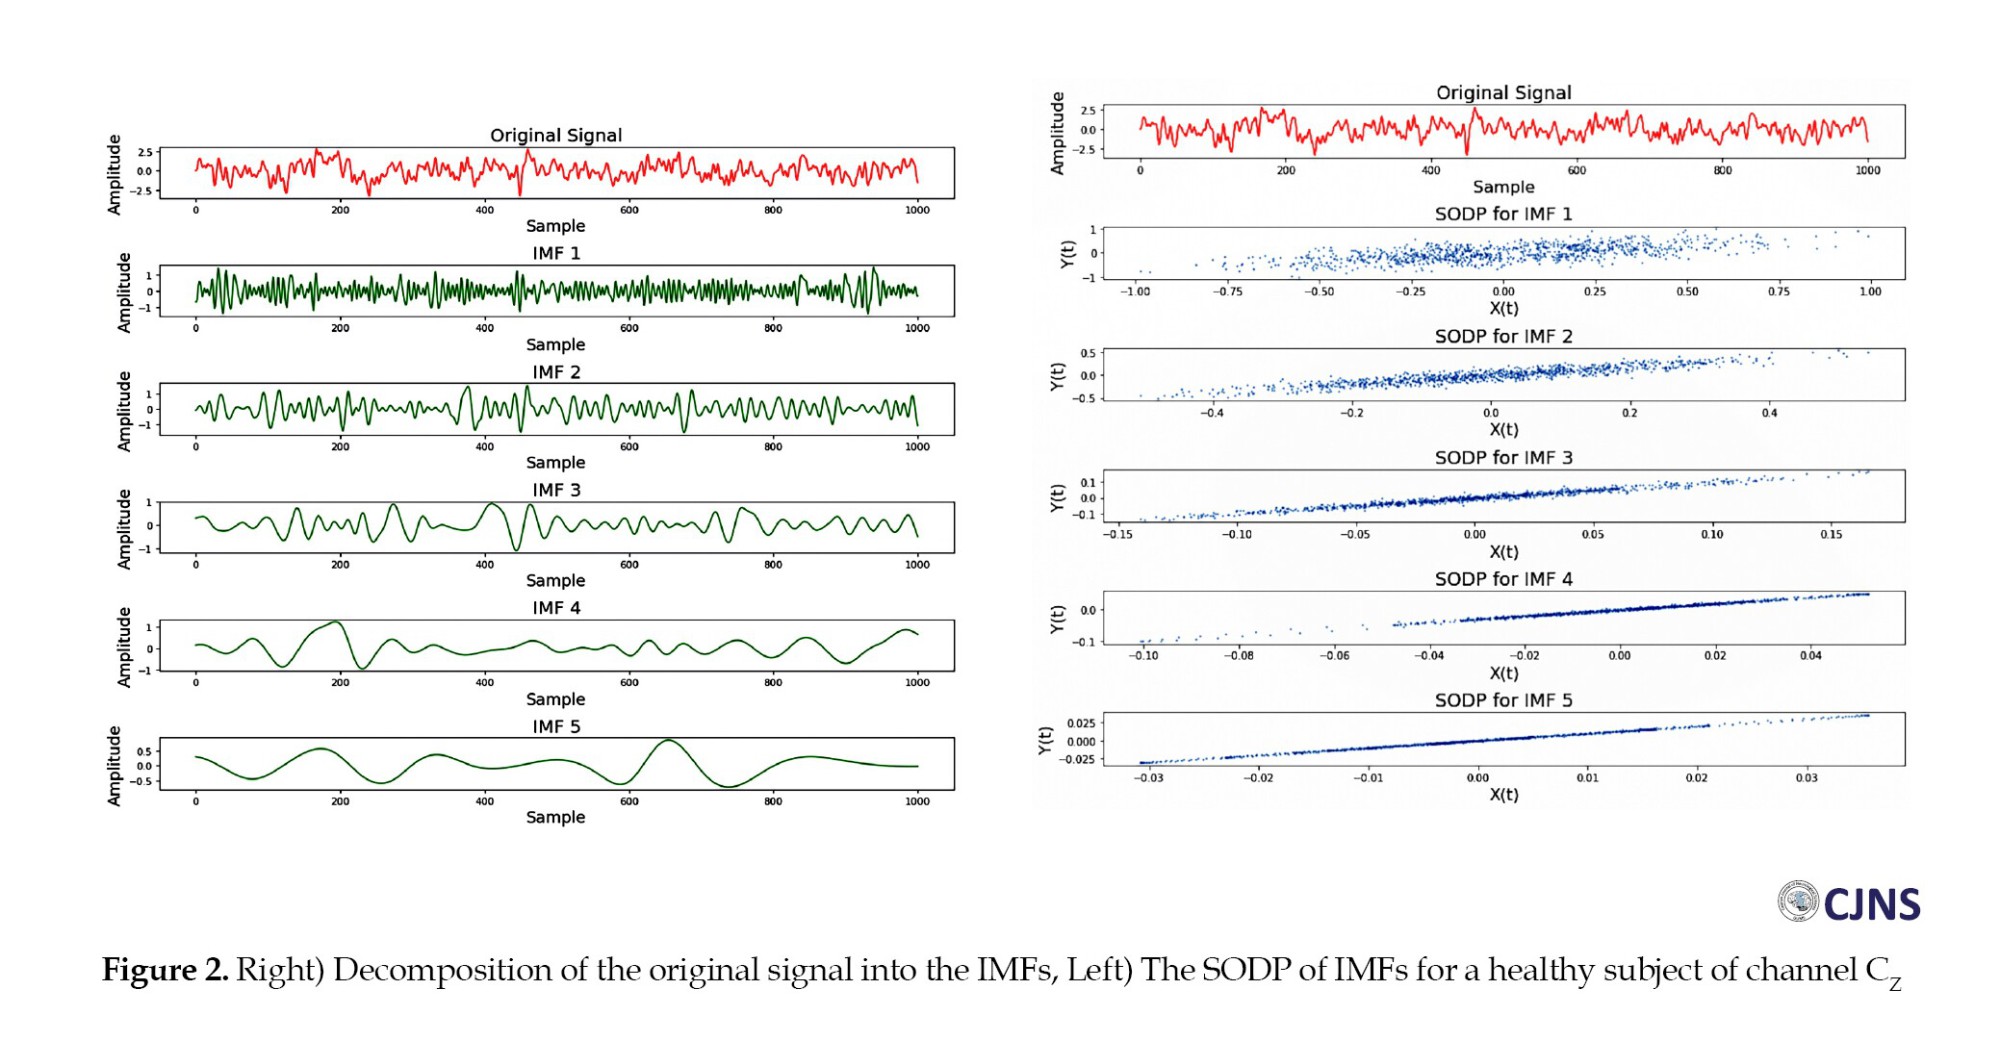
The elliptical patterns observed in the SODPs arise because the initial IMFs typically contain high-frequency and high-amplitude components, which result in more regular and predictable signal fluctuations. Specifically, the SODP for each IMF captures sequential variations—ie, second-order differences—within a two-dimensional space. When an IMF’s frequency and amplitude characteristics are consistent, the resulting SODP points cluster into distinct elliptical shapes.
This observed ellipticity provides a strong basis for discriminating between different classes within the dataset, significantly contributing to the high classification accuracy achieved by the proposed method. Accordingly, features were extracted from the first three IMFs, which exhibited the most prominent elliptical patterns. Parameters a and b, derived from Equations 10 and 11, were obtained from the respective SODP plots and used as discriminative features.
This feature extraction process was applied across all EEG channels, and the resulting feature set was used to train a decision tree classifier. The classifier’s performance was evaluated on a separate test set after training on the designated training subset. A 10-fold cross-validation procedure (with k=10) was employed to ensure robustness and minimize bias. This approach partitions the dataset into 10 equal subsets, cyclically alternating between training and testing to maximize the utilization of available data.
The entire procedure was repeated for various time window lengths to identify the optimal duration for feature extraction in each classification scenario. This iterative strategy ensures the selection of the most effective window size, thereby enhancing the robustness and overall accuracy of the proposed method.
The following classification problems were considered for the San Diego dataset to assess the effectiveness of the proposed method. Three classification problems were defined for this dataset:
P1) Open-eyes condition (Off-PD vs HC): During the eyes-open state, distinguish between PD patients off medication and the HC group
P2) Open-eyes condition (On-PD vs HC): Differentiating on-medication PD patients from HCs during the eyes-open state
P3) Open-eyes off–PD vs on-PD: With open eyes, distinguish between PD patients off medication and those on medication
Discussion
In this study, the window length was systematically varied to determine the optimal time window for feature extraction across various classification tasks, starting from 2 s and increasing in 1-s increments to a maximum of 8 seconds. For instance, in the case of a 2-s time window, the EEG signals were segmented into non-overlapping 2-s intervals, and the proposed features were extracted from each segment. These features were subsequently used to train the classifier.
This incremental strategy allows for a systematic evaluation of window lengths to achieve an optimal balance between feature richness and computational efficiency.
For the first classification task—distinguishing between the open-eyes off-medication PD group and HC—the EEG signals from each channel were initially filtered between 0.5 Hz and 40 Hz. The filtered signals were then segmented into non-overlapping 2-s windows. This segmentation process yielded 3030 segments for this classification task, comprising 1,500 segments from PD patients and 1530 from HCs.
Subsequent sections evaluate classification performance across multiple tasks using the proposed methodology. Table 3 summarizes the classification scenarios addressed in this study. As described previously, the performance of each classification model was assessed using 10-fold cross-validation. For each time window and classification scenario, the average accuracy across the ten folds and the standard deviation (reported as Mean±SD) were computed and reported.
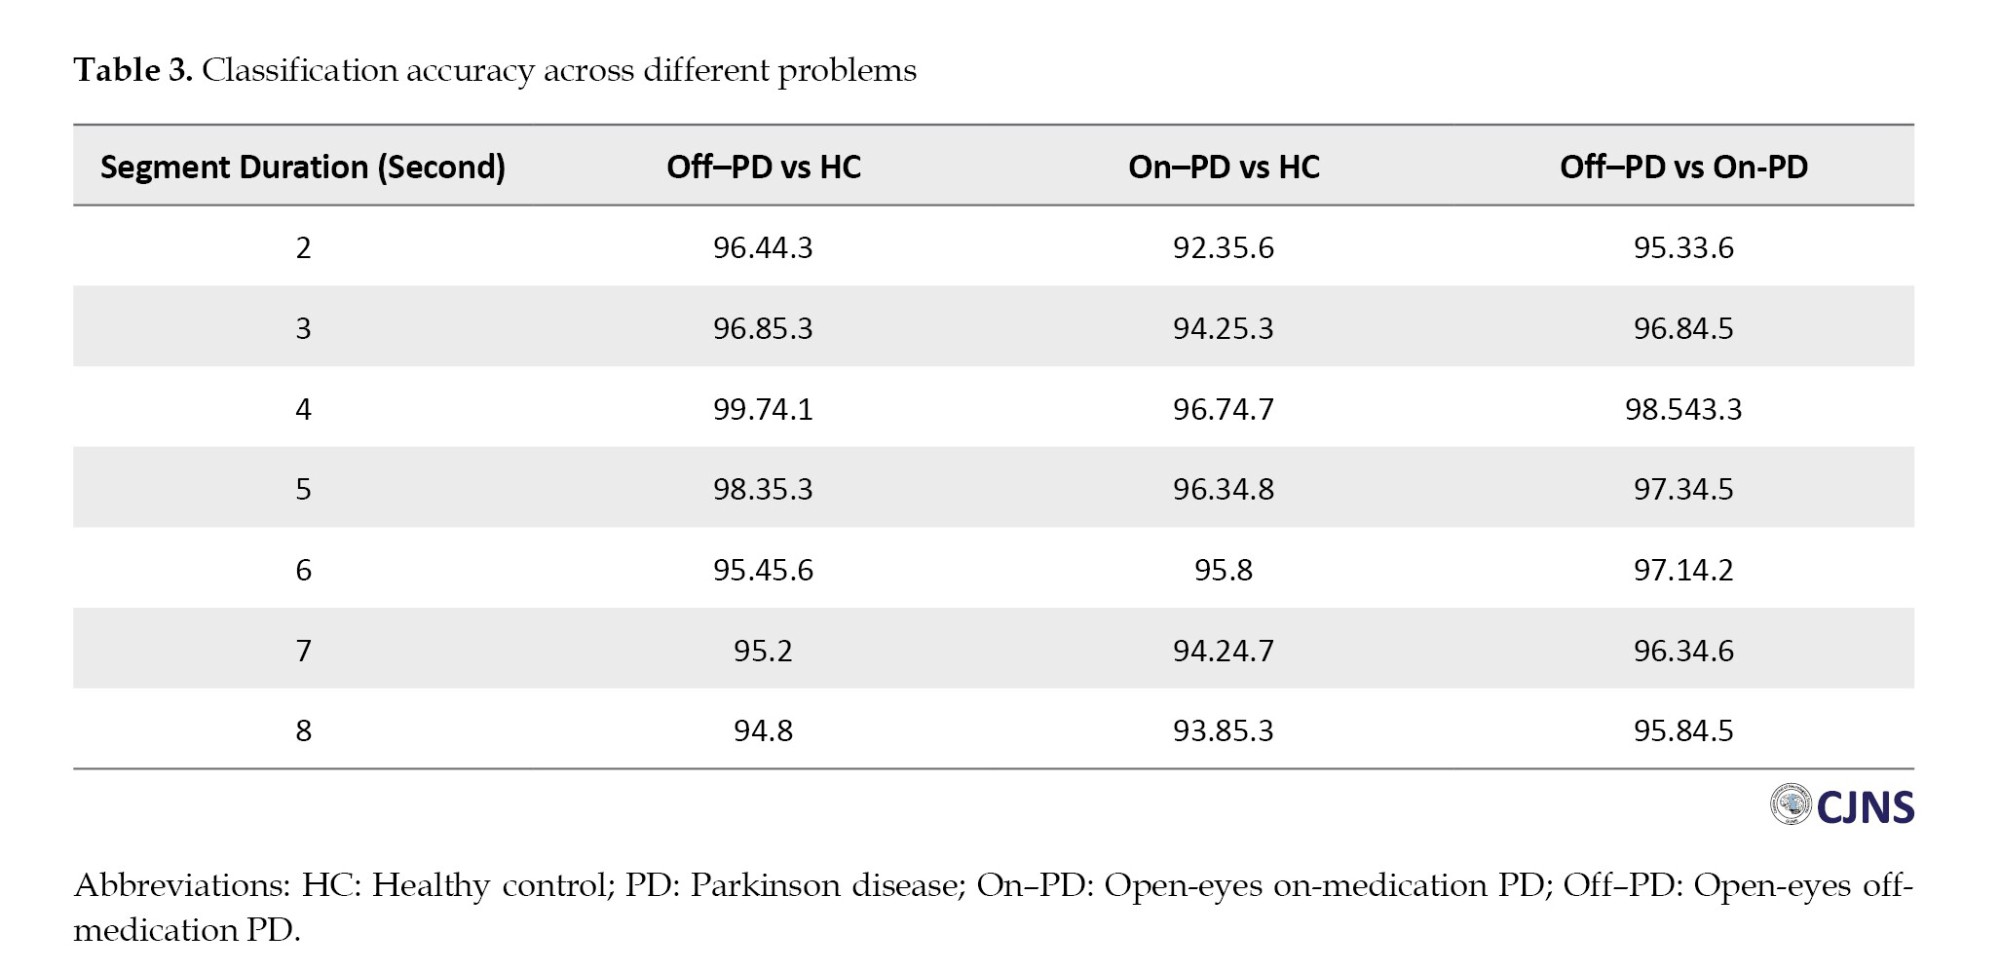
As illustrated in Table 3, the proposed method attained the highest classification accuracy when using a segment duration of 4 seconds. Specifically, for the classification task distinguishing open-eyes on-medication PD (on–PD) from HCs, the method performed optimally with 4-s segments—consistent with the results observed in the previous classification scenario.
The same table also reports results for classifying open-eyes off-medication PD (off–PD) versus on–PD. Once again, the highest accuracy was achieved using 4-second segments. These consistent outcomes across different tasks further validate the effectiveness of 4-second windows as the optimal choice for feature extraction within the proposed framework.
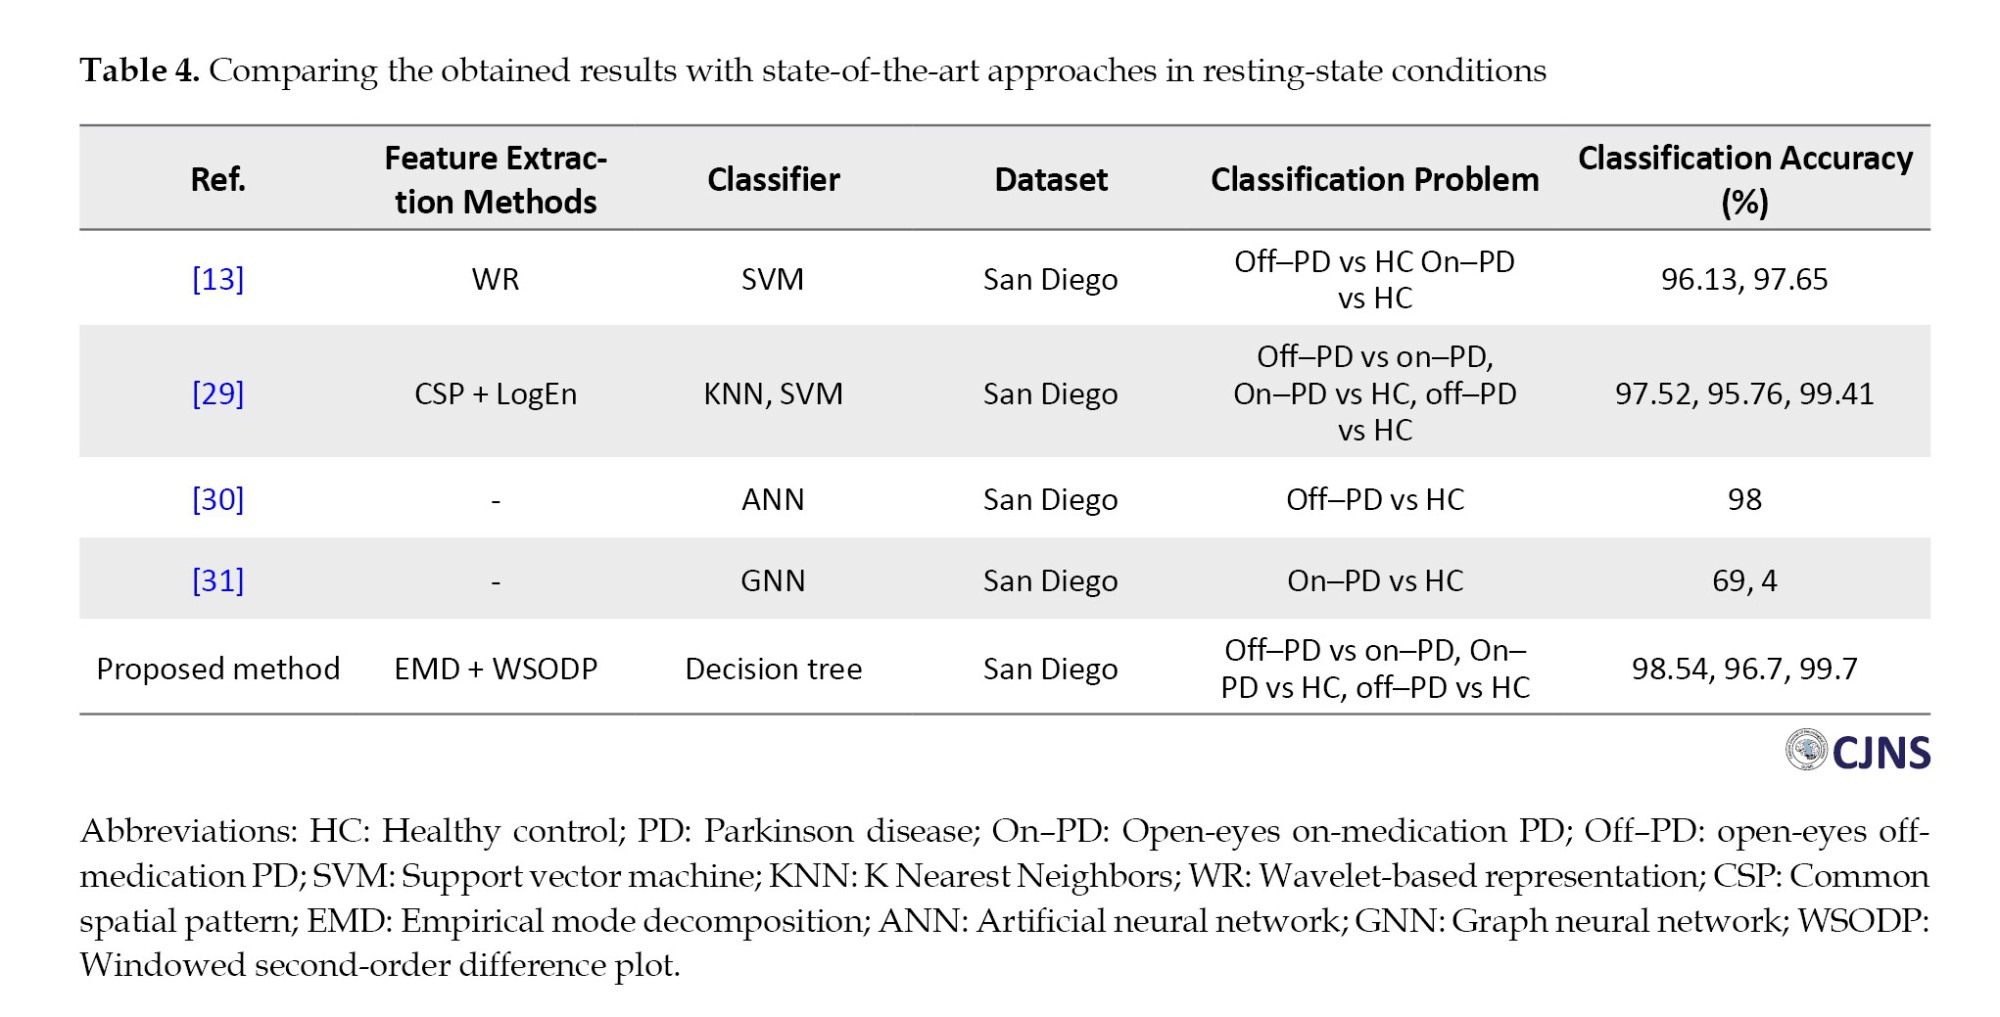
Following the performance evaluation, a comparative analysis was conducted between the results obtained using the proposed method and those reported in previous studies that utilized the same dataset and achieved notable performance. As illustrated in Table 4, the proposed method outperformed existing approaches regarding classification accuracy across all evaluated tasks. This comparison underscores the robustness and competitive advantage of the proposed approach in achieving superior classification performance.
Conclusion
This study introduced a novel approach for diagnosing PD through brain signal analysis, integrating advanced signal processing techniques with ML. The proposed method demonstrated exceptional classification performance across multiple clinical states of Parkinson’s patients. Specifically, the approach achieved classification accuracies of 99.7% for open-eyes off–PD vs HC, 96.7% for open-eyes on–PD vs HC, and 98.54% for open-eyes off–PD vs on–PD, highlighting its capacity to extract and interpret critical information from EEG signals.
The methodology employed EMD in combination with nonlinear dynamic analysis via the SODP to derive meaningful and discriminative features. The targeted use of the first three IMFs and selecting a 4-second time window were instrumental in enhancing classification accuracy and computational efficiency. The decision tree classifier, acting as the core classification model, demonstrated strong performance distinguishing between classes through its interpretable and rule-based architecture.
These findings validate the effectiveness of the proposed framework in facilitating early and accurate detection of PD and underscore its potential for integration into AI-powered clinical decision support systems. Although the approach was evaluated using the San Diego EEG dataset, future work should assess its generalizability across more heterogeneous datasets and in real-world clinical environments. Furthermore, combining this methodology with other emerging diagnostic tools could significantly enhance the precision and scope of PD diagnosis and management.
Ethical Considerations
Compliance with ethical guidelines
This study utilized a publicly available dataset, as detailed in the manuscript. Consequently, no new data were collected from human or animal subjects, and ethical approval was not required.
Funding
This research did not receive any grant from funding agencies in the public, commercial, or non-profit sectors. this study was extracted from the master's thesis of Delshad Ghavami’s, approved by the Department of Dynamics, Control and Vibrations, Faculty of Mechanical Engineering, University of Guilan, Rasht, Iran.
Authors contributions
Conceptualization and methodology: Delshad Ghavami and Moein Radman; Analysis and validation: Moein Radman; Writing: Delshad Ghavami; Supervision and project administration: Ali Chaibakhsh and Moein Radman.
Conflict of interest
The authors declared no conflict of interest.
Acknowledgements
The authors sincerely acknowledge and appreciate the efforts of the researchers and institutions involved in developing and publicly disseminating the San Diego EEG dataset. Their valuable contribution provided a critical foundation for conducting this study.
References
Parkinson disease (PD) is classified as a neurological illness that progresses gradually and can be diagnosed through a combination of motor and non-motor symptoms [1]. In people over 60, the prevalence of PD is increasing, currently affecting approximately 1% of this population [2]. Neurological disorders are presently the leading cause of disability worldwide, and PD is considered the fastest-growing among them [3]. PD ranks as the second most prevalent neurodegenerative disorder and is marked by the permanent degeneration of dopamine-producing neurons [4]. Therefore, PD is classified as a neurological condition that progressively worsens over time. Among individuals affected by PD, the dopamine-producing neurons within the substantia nigra first exhibit functional decline before degenerating. This neuronal degeneration impairs the brain’s ability to control body movements. Symptoms include tremors, akinesia (absence of voluntary movement), bradykinesia (slowness of movement), and difficulties with walking and posture [5]. In the absence of clear motor symptoms, diagnosing the disease can be challenging. Therefore, computer-aided detection systems can automatically detect PD using electroencephalogram [6].
Given the challenges in the early diagnosis of PD and the progressive decline in motor control, numerous studies have focused on developing machine learning (ML)-based diagnostic methods. For instance, Aljalal et al. applied the discrete wavelet transform to analyze electroencephalography (EEG) signals from the San Diego and University of New Mexico (UNM) datasets in combination with various entropy-based measures. Subsequently, ML algorithms were used to differentiate patients with PD from healthy controls (HCs) [7].
Srikanth et al. employed a feature extraction method based on ensemble empirical mode decomposition (EMD) to enhance the accuracy of PD diagnosis. A range of ML and deep learning classification models were evaluated, with Convolutional Neural Networks (CNNs) yielding the highest accuracy of 98% [8]. Govindu and Palwe applied ML techniques to voice data features (MDVP 30) to classify patients with PD using a random forest model. This model was compared with support vector machine (SVM) and K nearest neighbors (KNN), and logistic regression classifiers, achieving an accuracy of 91.83% [9]. Hussain et al. used audio data to classify PD with SVM, random forest, and KNN models, validated through k-fold cross-validation. These studies emphasize the effectiveness of ML approaches in PD detection [10] .
Table 1 provides a summary of the related studies and their results. This study proposes a robust time-domain approach for PD detection. The method improves diagnostic performance using EEG-based brain signals by enhancing the feature extraction and feature selection stages within ML pipelines [11]. EEG signals are segmented using a windowing technique, and EMD is applied to extract intrinsic mode functions (IMFs). A nonlinear time series analysis method is applied to each IMF, and components with higher informational content are selected for feature extraction. These features are obtained from all EEG channels and used to train a decision tree classifier for final classification.
The proposed method was evaluated using the San Diego dataset, which demonstrated remarkable accuracy in classifying different conditions of patients with PD. The experimental results are analyzed and discussed in detail in this paper’s “results” and “discussion” sections.
Materials and Methods
The flowchart of the presented approach aimed at improving the performance of PD diagnosis based on brain signals is shown in Figure 1. Initially, The data are split into two distinct sets: One for training and the other for testing. A windowing technique is then utilized on the training data to divide it into smaller segments, where the window length significantly influences system performance.
Following segmentation, EMD is applied to decompose the signal into multiple components. Subsequently, features are extracted from these segments using the second-order difference plot (SODP) method and are later employed to train the classifier. Once classification accuracy is obtained, the windowing parameters are assessed, and the window size yielding the best performance is selected.
Finally, the optimal parameters derived from the training phase are applied to the test data to evaluate the overall system performance. The following sections of this paper provide a detailed discussion of the dataset, methodology, and experimental results.
Dataset and pre-processing
The method proposed in this study was evaluated using the San Diego dataset [16], which includes demographic and clinical information of the participants, as summarized in Table 2. EEG data were acquired using a 32-channel system over a minimum duration of three minutes, with a sampling rate of 512 Hz. The electrode placement used for EEG acquisition is presented in Table 2.
Feature extraction
EMD
EMD is a flexible technique for obtaining time-frequency information from a signal. It breaks down the signal into IMF components. The original signal is processed using a specialized technique known as the screening process to extract the IMFs [17-19]. Accordingly, the original signal is represented as illustrated in Equation 1:
An IMF refers to a numerical or analytical function that meets the following criteria:
a) The number of local extrema and zero crossings must be either equal or differ by no more than one,
b) The integral of the function over the defined time interval is zero, indicating that the mean of the envelope formed by the local maxima and the envelope formed by the local minima is zero at every point.
The extraction of IMFs, also known as the screening process, is an iterative procedure consisting of the following steps:
1) The local maxima and minima within the input signal x(t) are first detected.
2) The upper and lower envelopes are generated by interpolating through the local maxima and minima points, respectively.
3) The mean values of the upper and lower envelopes are computed using Equation 2.
4) Creating the first component of the signal according to Equation 3:
5) Investigating the conditions of the IMFs and measuring the stopping based on the Equation 4:
6) If condition 5 does not appear, replace the signal from stage 4 with the main signal and continue from stage 1.
7) If condition 6 is met, the screening process is over and is considered the first inherent mode function.
8) Suppose the remaining part satisfies the conditions of the IMFs. In that case, an IMF is considered, and in the absence of condition a, it is accepted as the initial signal, and steps 1 to 4 are repeated; otherwise, the equation [5] is considered as the remainder:
The above steps are performed times until IMF is obtained.
SODP
This method analyzes time series with nonlinear characteristics [20]. This method displays a graph of consecutive rates against each other. We can extract useful diagnostic information using the SODP of the IMFs of EEG signals [21]. In this part, the SODP diagram for plotting X(n) vs Y(n) is defined by the following equations:
By using central tendency measurement, we can measure variability in this chart and, by reducing the sampling distance, appropriately scale the rates and get closer to continuous data results [22]. The SODP related to IMFs shows the EEG signals of elliptical shapes [21]. To determine the confidence region of SODP from IMFs, we use the following relationships:
The parameter and the area of the ellipse are calculated as follows:
Classification
Decision tree classifier
Decision trees are widely used in ML as an effective method for classifying and organizing data into distinct categories [23]. This approach relies on a hierarchical, tree-based structure, where each path originates from the root node and proceeds through a sequence of data splits until a binary decision is reached at a leaf node [24]. The core concept behind decision trees is to iteratively answer a series of binary (yes/no) questions to reach a classification outcome [25-27]. The Gini index and entropy are commonly used criteria for evaluating decision tree performance [28].
Decision trees are an effective tool in ML [23] used to classify and organize data into categories. This classification method employs a tree-based structure, where each path originates at the root node and follows a sequence of data-driven splits until a Boolean outcome is reached at a leaf node [24]. The main concept of the decision tree is to answer questions with yes or no options [25, 26].
Results
As illustrated in Figure 1, this study explores the effect of time window selection on feature extraction, aiming to determine the most appropriate window length for the dataset utilized. The analysis begins with an initial window length of 2 seconds. The EEG signals are processed within each window using EMD to extract their corresponding IMFs.
IMFs are crucial for signal analysis, as they represent intrinsic components of the signal across distinct frequency bands. Each IMF encapsulates localized oscillatory behavior that reflects the inherent characteristics of the original signal. Due to these properties, IMFs are particularly effective in analyzing complex and nonlinear signal patterns.
Moreover, IMFs facilitate extracting meaningful information from signals, support the analysis of temporal dynamics, and contribute to noise reduction and anomaly detection. In this study, the extracted IMFs are integral to evaluating the influence of time window selection on signal analysis and improving the accuracy of feature extraction.
Figure 2 illustrates a segment of the EEG signal from a single channel alongside its corresponding IMFs. The next step involves extracting features from the first three IMFs selected for this analysis based on their relevance to the signal's dominant oscillatory components. The SODPs of these IMFs, also shown in Figure 2, reveal elliptical patterns. These elliptical shapes emerge from strong correlations between successive data points within the initial IMFs, indicating consistent temporal structure in the underlying signal.
The elliptical patterns observed in the SODPs arise because the initial IMFs typically contain high-frequency and high-amplitude components, which result in more regular and predictable signal fluctuations. Specifically, the SODP for each IMF captures sequential variations—ie, second-order differences—within a two-dimensional space. When an IMF’s frequency and amplitude characteristics are consistent, the resulting SODP points cluster into distinct elliptical shapes.
This observed ellipticity provides a strong basis for discriminating between different classes within the dataset, significantly contributing to the high classification accuracy achieved by the proposed method. Accordingly, features were extracted from the first three IMFs, which exhibited the most prominent elliptical patterns. Parameters a and b, derived from Equations 10 and 11, were obtained from the respective SODP plots and used as discriminative features.
This feature extraction process was applied across all EEG channels, and the resulting feature set was used to train a decision tree classifier. The classifier’s performance was evaluated on a separate test set after training on the designated training subset. A 10-fold cross-validation procedure (with k=10) was employed to ensure robustness and minimize bias. This approach partitions the dataset into 10 equal subsets, cyclically alternating between training and testing to maximize the utilization of available data.
The entire procedure was repeated for various time window lengths to identify the optimal duration for feature extraction in each classification scenario. This iterative strategy ensures the selection of the most effective window size, thereby enhancing the robustness and overall accuracy of the proposed method.
The following classification problems were considered for the San Diego dataset to assess the effectiveness of the proposed method. Three classification problems were defined for this dataset:
P1) Open-eyes condition (Off-PD vs HC): During the eyes-open state, distinguish between PD patients off medication and the HC group
P2) Open-eyes condition (On-PD vs HC): Differentiating on-medication PD patients from HCs during the eyes-open state
P3) Open-eyes off–PD vs on-PD: With open eyes, distinguish between PD patients off medication and those on medication
Discussion
In this study, the window length was systematically varied to determine the optimal time window for feature extraction across various classification tasks, starting from 2 s and increasing in 1-s increments to a maximum of 8 seconds. For instance, in the case of a 2-s time window, the EEG signals were segmented into non-overlapping 2-s intervals, and the proposed features were extracted from each segment. These features were subsequently used to train the classifier.
This incremental strategy allows for a systematic evaluation of window lengths to achieve an optimal balance between feature richness and computational efficiency.
For the first classification task—distinguishing between the open-eyes off-medication PD group and HC—the EEG signals from each channel were initially filtered between 0.5 Hz and 40 Hz. The filtered signals were then segmented into non-overlapping 2-s windows. This segmentation process yielded 3030 segments for this classification task, comprising 1,500 segments from PD patients and 1530 from HCs.
Subsequent sections evaluate classification performance across multiple tasks using the proposed methodology. Table 3 summarizes the classification scenarios addressed in this study. As described previously, the performance of each classification model was assessed using 10-fold cross-validation. For each time window and classification scenario, the average accuracy across the ten folds and the standard deviation (reported as Mean±SD) were computed and reported.
As illustrated in Table 3, the proposed method attained the highest classification accuracy when using a segment duration of 4 seconds. Specifically, for the classification task distinguishing open-eyes on-medication PD (on–PD) from HCs, the method performed optimally with 4-s segments—consistent with the results observed in the previous classification scenario.
The same table also reports results for classifying open-eyes off-medication PD (off–PD) versus on–PD. Once again, the highest accuracy was achieved using 4-second segments. These consistent outcomes across different tasks further validate the effectiveness of 4-second windows as the optimal choice for feature extraction within the proposed framework.
Following the performance evaluation, a comparative analysis was conducted between the results obtained using the proposed method and those reported in previous studies that utilized the same dataset and achieved notable performance. As illustrated in Table 4, the proposed method outperformed existing approaches regarding classification accuracy across all evaluated tasks. This comparison underscores the robustness and competitive advantage of the proposed approach in achieving superior classification performance.
Conclusion
This study introduced a novel approach for diagnosing PD through brain signal analysis, integrating advanced signal processing techniques with ML. The proposed method demonstrated exceptional classification performance across multiple clinical states of Parkinson’s patients. Specifically, the approach achieved classification accuracies of 99.7% for open-eyes off–PD vs HC, 96.7% for open-eyes on–PD vs HC, and 98.54% for open-eyes off–PD vs on–PD, highlighting its capacity to extract and interpret critical information from EEG signals.
The methodology employed EMD in combination with nonlinear dynamic analysis via the SODP to derive meaningful and discriminative features. The targeted use of the first three IMFs and selecting a 4-second time window were instrumental in enhancing classification accuracy and computational efficiency. The decision tree classifier, acting as the core classification model, demonstrated strong performance distinguishing between classes through its interpretable and rule-based architecture.
These findings validate the effectiveness of the proposed framework in facilitating early and accurate detection of PD and underscore its potential for integration into AI-powered clinical decision support systems. Although the approach was evaluated using the San Diego EEG dataset, future work should assess its generalizability across more heterogeneous datasets and in real-world clinical environments. Furthermore, combining this methodology with other emerging diagnostic tools could significantly enhance the precision and scope of PD diagnosis and management.
Ethical Considerations
Compliance with ethical guidelines
This study utilized a publicly available dataset, as detailed in the manuscript. Consequently, no new data were collected from human or animal subjects, and ethical approval was not required.
Funding
This research did not receive any grant from funding agencies in the public, commercial, or non-profit sectors. this study was extracted from the master's thesis of Delshad Ghavami’s, approved by the Department of Dynamics, Control and Vibrations, Faculty of Mechanical Engineering, University of Guilan, Rasht, Iran.
Authors contributions
Conceptualization and methodology: Delshad Ghavami and Moein Radman; Analysis and validation: Moein Radman; Writing: Delshad Ghavami; Supervision and project administration: Ali Chaibakhsh and Moein Radman.
Conflict of interest
The authors declared no conflict of interest.
Acknowledgements
The authors sincerely acknowledge and appreciate the efforts of the researchers and institutions involved in developing and publicly disseminating the San Diego EEG dataset. Their valuable contribution provided a critical foundation for conducting this study.
References
- Jankovic J. Parkinson's disease: Clinical features and diagnosis. J Neurol Neurosurg Psychiatry. 2008; 79(4):368-76. [DOI:10.1136/jnnp.2007.131045] [PMID]
- Tysnes OB, Storstein A. Epidemiology of Parkinson's disease. J Neural Transm. 2017; 124(8):901-5. [DOI:10.1007/s00702-017-1686-y] [PMID]
- Dorsey R, Sherer T, Okun MS, Bloem BR. Ending Parkinson’s disease: A prescription for action. New York: PublicAffairs; 2020. [DOI:10.1511/2020.108.3.176]
- Nass R, Przedborski S. Parkinson’s disease: molecular and therapeutic insights from model systems. New York: Elsevier; 2008. [Link]
- Weiner WJ, Shulman LM, Lang AE. Parkinson’s disease: A complete guide for patients and families. 3th ed. Baltimore: JHU Press; 2013. [Link]
- Oh SL, Hagiwara Y, Raghavendra U, Yuvaraj R, Arunkumar N, Murugappan M, et al. A deep learning approach for Parkinson’s disease diagnosis from EEG signals. Neural Comput.Appl. 2020; 32:10927-33. [DOI:10.1007/s00521-018-3689-5]
- Aljalal M, Aldosari SA, Molinas M, AlSharabi K, Alturki FA. Detection of Parkinson's disease from EEG signals using discrete wavelet transform, different entropy measures, and machine learning techniques. Sci Rep. 2022; 12(1):22547.[DOI:10.1038/s41598-022-26644-7] [PMID] [PMCID]
- Srikanth NB, Priya SJ, Subathra M, editors. Detection of Parkinson’s disease from EEG signals with EEMD using machine learning and deep learning techniques. paper presented: 2nd International Conference on Sustainable Computing and Smart Systems (ICSCSS). 10-12 July 2024; Coimbatore, India. [DOI:10.1109/ICSCSS60660.2024.10625452]
- Govindu A, Palwe S. Early detection of Parkinson’s disease using machine learning. Procedia Comput Sci. 2023; 218:249-61. [DOI:10.1016/j.procs.2023.01.007]
- Hussain MM, Weslin D, Kumari S, Umamaheswari S, Kamalakannan K. Enhancing Parkinson’s disease identification using ensemble classifier and data augmentation techniques in machine learning. Clin eHealth. 2023; 6:150-8. [DOI:10.1016/j.ceh.2023.11.002]
- Radman M, Chaibakhsh A, Nariman-zadeh N, He H. Feature fusion for improving performance of motor imagery brain-computer interface system. Biomed Signal Process Control. 2021; 68:102763. [DOI:10.1016/j.bspc.2021.102763]
- Singh G, Vadera M, Samavedham L, Lim ECH. Machine learning-based framework for multi-class diagnosis of neurodegenerative diseases: A study on Parkinson’s disease. IFAC-PapersOnLine. 2016; 49(7):990-5. [DOI:10.1016/j.ifacol.2016.07.331]
- Khare SK, Bajaj V, Acharya UR. Detection of Parkinson’s disease using automated tunable Q wavelet transform technique with EEG signals. Biocybern Biomed Eng. 2021; 41(2):679-89. [DOI:10.1016/j.bbe.2021.04.008]
- Shi D, Yao X, Li Y, Zhang H, Wang G, Wang S, et al. Classification of Parkinson's disease using a region-of-interest- and resting-state functional magnetic resonance imaging-based radiomics approach. Brain Imaging Behav. 2022; 16(5):2150-63. [DOI:10.1007/s11682-022-00685-y] [PMID]
- Lamba R, Gulati T, Alharbi HF, Jain A. A hybrid system for Parkinson’s disease diagnosis using machine learning techniques. Int J Speech Technol. 2022; 25:583–93. [DOI:10.1007/s10772-021-09837-9]
- Rockhill AP, Jackson N, George J, Aron A, Swann NC. UC San Diego resting state EEG data from patients with Parkinson’s disease. Stanford: Openneuro; 2020. [Link]
- Huang NE, Shen Z, Long SR, Wu MC, Shih HH, Zheng Q, et al. The empirical mode decomposition and the Hilbert spectrum for nonlinear and non-stationary time series analysis. Proceedings of the Royal Society of London Series A: Mathematical, physical and engineering sciences. 1998; 454(1971):903-95. [DOI:10.1098/rspa.1998.0193]
- Williams N, Nasuto SJ, Saddy JD. Evaluation of empirical mode decomposition for event-related potential analysis. EURASIP J Adv Signal Process. 2011; 2011:965237. [DOI:10.1155/2011/965237]
- Arghand R, Chaibakhsh A, Radman M. Improving motor imagery classification in BCI systems using EMD and multi-layer CNNs. paper presented: 14th International Conference on Computer and Knowledge Engineering (ICCKE). 19-20 November 2024; Mashhad, Iran. [DOI:10.1109/ICCKE65377.2024.10874821]
- Altan G, Kutlu Y, Yeniad M. ECG based human identification using second order difference plots. Comput Methods Programs Biomed. 2019; 170:81-93. [DOI:10.1016/j.cmpb.2019.01.010] [PMID]
- Zhu Q, Azar AT. Complex system modelling and control through intelligent soft computations. 1th ed. Cham: Springer Cham; 2015. [DOI:10.1007/978-3-319-12883-2]
- Thuraisingham RA, Tran Y, Boord P, Craig A. Analysis of eyes open, eye closed EEG signals using second-order difference plot. Med Biol Eng Comput. 2007; 45(12):1243-9. [DOI:10.1007/s11517-007-0268-9] [PMID]
- Trabelsi A, Elouedi Z, Lefevre E. Decision tree classifiers for evidential attribute values and class labels. Fuzzy Sets Syst. 2019; 366:46-62. [DOI:10.1016/j.fss.2018.11.006]
- Taha Jijo B, Abdulazeez AM. Classification based on decision tree algorithm for machine learning. J Appl Sci Technol Trends. 2021; 2(01):20-8. [DOI:10.38094/jastt20165]
- Mahmoud AY. Novel efficient feature selection: Classification of medical and immunotherapy treatments utilising Random Forest and Decision Trees. Intell-Based Med. 2024; 10:100151. [DOI:10.1016/j.ibmed.2024.100151]
- Radman M, Moradi M, Chaibakhsh A, Kordestani M, Saif M. Multi-feature fusion approach for epileptic seizure detection from EEG signals. IEEE Sens J. 2021; 21(3):3533-43. [DOI:10.1109/JSEN.2020.3026032]
- Radman M, Chaibakhsh A, Nariman-zadeh N, He H. Generalized sequential forward selection method for channel selection in EEG signals for classification of left or right hand movement in BCI. Paper presented: 9th International Conference on Computer and Knowledge Engineering (ICCKE). 24-25 Octobe 2019. Mashhad, Iran. [DOI:10.1109/ICCKE48569.2019.8965159]
- Kingsford C, Salzberg SL. What are decision trees? Nat Biotechnol. 2008; 26(9):1011-3. [DOI:10.1038/nbt0908-1011] [PMID] [PMCID]
- Aljalal M, Aldosari SA, AlSharabi K, Abdurraqeeb AM, Alturki FA. Parkinson's disease detection from resting-state EEG signals using common spatial pattern, entropy, and machine learning techniques. Diagnostics. 2022; 12(5):1033.[DOI:10.3390/diagnostics12051033] [PMID] [PMCID]
- Shaban M. Automated screening of Parkinson’s disease using deep learning based electroencephalography. paper presented: 10th International IEEE/EMBS Conference on Neural Engineering (NER). 4-6 May 2021. Italy. [DOI:10.1109/NER49283.2021.9441065]
- Neves C, Zeng Y, Xiao Y. Parkinson’s disease detection from resting state EEG using multi-head graph structure learning with gradient weighted graph attention explanations. In: Bathula DR, Nirmala AB, Dvornek NC, Govindarajan ST, Habes M, Kumar V, editors. Machine learning in clinical neuroimaging. Cham: Springer; 2025. [DOI:10.1007/978-3-031-78761-4_1]
Type of Study: Research |
Subject:
General
Received: 2025/01/10 | Accepted: 2025/03/3 | Published: 2025/07/1
Received: 2025/01/10 | Accepted: 2025/03/3 | Published: 2025/07/1
Send email to the article author
| Rights and permissions | |
 | This work is licensed under a Creative Commons Attribution-NonCommercial 4.0 International License. |

Copyright © The Author(s);
This is an open access article distributed under the terms of the Creative Commons Attribution License (CC-By-NC), which permits use, distribution, and reproduction in any medium, provided the original work is properly cited and is not used for commercial purposes.
Contact Information