Mon, Feb 16, 2026
Volume 11, Issue 1 (Winter 2025)
Caspian J Neurol Sci 2025, 11(1): 38-50 |
Back to browse issues page


Ethics code: IR.IAU.RASHT.REC.1401.027
Download citation:
BibTeX | RIS | EndNote | Medlars | ProCite | Reference Manager | RefWorks
Send citation to:


BibTeX | RIS | EndNote | Medlars | ProCite | Reference Manager | RefWorks
Send citation to:
Montakhab Madani M, Rahmati Ghofrani Y, Yousefzadeh Chabok S, Saberi Haghayegh R A. Analysis of Users’ Neural Responses to Native Advertisements Using Cognitive Indicators and Electroencephalography. Caspian J Neurol Sci 2025; 11 (1) :38-50
URL: http://cjns.gums.ac.ir/article-1-734-en.html
URL: http://cjns.gums.ac.ir/article-1-734-en.html
Mina Montakhab Madani1 

 , Yalda Rahmati Ghofrani *2 , Shahrokh Yousefzadeh Chabok3 , Rahmat Ali Saberi Haghayegh4
, Yalda Rahmati Ghofrani *2 , Shahrokh Yousefzadeh Chabok3 , Rahmat Ali Saberi Haghayegh4
1- Department of Business Management, Faculty of Accounting Administration, Rasht Branch, Islamic Azad University, Rasht, Iran.
2- Department of Business Management, Faculty of Accounting Administration, Rasht Branch, Islamic Azad University, Rasht, Iran. ,rahmati@iaurasht.ac.ir
3- Neuroscience Research Center, Guilan University of Medical Sciences, Rasht, Iran.
4- Department of Management, Bandar Anzali Branch, Islamic Azad University, Bandar Anzali, Iran.
2- Department of Business Management, Faculty of Accounting Administration, Rasht Branch, Islamic Azad University, Rasht, Iran. ,
3- Neuroscience Research Center, Guilan University of Medical Sciences, Rasht, Iran.
4- Department of Management, Bandar Anzali Branch, Islamic Azad University, Bandar Anzali, Iran.
Full-Text [PDF 2151 kb]
(581 Downloads)
| Abstract (HTML) (1280 Views)
Full-Text: (621 Views)
Introduction
Advertising is key to embedding a company’s name in customers’ minds. Therefore, organizations must implement it effectively. Today, due to increased advertising avoidance, publishers have been forced to seek new ways to monetize their digital content. One solution to this challenge has been native advertising [1]. Native advertising is a type of advertisement that blends with the content of the platform where it appears, making it sometimes indistinguishable from other content [2]. Meeting customer expectations and identifying the factors influencing purchasing decisions are crucial in developing successful marketing and advertising strategies [3]. Evaluating effectiveness reveals limitations as it relies on the client’s willingness and ability to articulate their feelings when exposed to advertisements [4]. Various methods and tools have been employed to gain deeper insights into consumer behavior and the impact of advertising messages. However, these approaches have inherent limitations and significant biases, making it impossible to understand consumer thought processes fully [5]. Cognitive processes involve many subconscious elements. Methods like “articulated answers,” including market research, surveys and focus groups, are not ideal for understanding an individual’s feelings about a product or service. In focus groups, participants’ responses may be swayed by dominant group opinions and external factors like incentives, time constraints, and pressure, which can affect the results. Similarly, surveys require large sample sizes and carefully designed tools to account for variables such as language, education and cultural differences among the participants [4]. In-depth interviews are valuable for understanding consumers’ perspectives, attitudes and value judgments. However, they are often subjective, as they depend on self-reported information, which can be biased and challenging to interpret objectively [6]. Neuromarketing offers profound insights into customers’ motivations, preferences, and decisions by analyzing physiological and neural signals and examining their cognitive and emotional responses to marketing stimuli [3]. Neuromarketing is a growing discipline integrating insights from marketing, neuroscience, economics, decision-making theories and psychology [7]. Neuromarketing is a valuable research approach as it leverages neuroscientific theories and techniques to uncover information that would otherwise remain inaccessible. This data is obtained by observing neural processes, bypassing the need to directly question individuals’ thoughts, emotions, memories, evaluations, or decision-making strategies [8]. Neuromarketing enhances the efficiency of marketing processes by analyzing responses to marketing stimuli through techniques like brain imaging and eye tracking without relying on consumer self-reports. It assesses and quantifies mental states, shifts in attention, initial impressions, message recall levels, and the emotional reactions triggered by specific stimuli [9]. Neuromarketing examines consumer thought processes and identifies factors influencing purchasing decisions. It utilizes neural and physiological metrics to explore subconscious brain activity during product evaluation. By eliminating reliance on consumer self-reported answers, this marketing offers valuable insights into consumers’ decision-making processes [10].
The fast fourier transform (FFT) method analyzes brainwave signals. Through mathematical operations, FFT decomposes electroencephalography (EEG) signals into their sinusoidal components (frequency domain representation). This method transforms EEG signals from the time domain to the frequency domain, breaking down the time-domain signals into their constituent frequency components [11]. Most studies on EEG-based emotion recognition highlight the alpha, beta, and occasionally theta frequency bands as the most effective for distinguishing an individual’s emotional state [12]. Changes in brain activity related to emotions and attention occur in the frontal lobe, which is the most active area for the propagation of alpha, beta and theta waves, and are helpful for cognitive processing studies [13].
The current research analyzes theta, alpha, and beta brainwave frequencies. Similar studies to the present research have shown that the most important brain regions responsible for decision-making and preferences (such as liking or disliking) are the frontal electrodes, mainly F4, F8, F3 and F7. These regions are especially effective in analyzing priorities and the absolute power spectral density (PSD) [13]. Therefore, using neuromarketing techniques and tools alongside traditional methods can be a practical step in enhancing the effectiveness of advertising strategies. An effective advertisement can capture the audience’s attention, create a memorable impact, stimulate the audience’s purchasing behavior, and awaken the audience’s sensory perception [14].
Examining users’ reactions after encountering and understanding a message as an advertisement is a prerequisite for this research. This research aims to study users’ brain waves before and during the viewing of native advertising and to examine the relationship between neural responses of the brain and self-report. Therefore, this research seeks to answer the following questions: Is there a significant difference in the absolute power of brainwaves between the two states of rest and exposure to effective native advertising? Is there a significant relationship between neural responses of the brain and self-report?
Materials and Methods
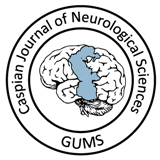
This research focuses on analyzing the average PSD for specific frontal channels of the brain. The right frontal channels (Fp2, F4, F8) and the left frontal channels (Fp1, F3, F7) have been selected due to their significant roles in decision-making and preference formation processes.
Participants and sample size
Neuromarketing studies are conducted with small sample sizes due to the complexity of the experiments. At least 15 to 20 participants are required for such studies. The findings from these studies can be generalized because brain mechanisms are similar among individuals [15]. Numerous neuroscience studies, including Hsu and Chen [7], have adopted this approach. A total of 20 participants successfully passed the initial selection and proceeded to participate in this study. The sample consists of 10 men and 10 women from the staff and students of Guilan University of Medical Sciences, aged between 19 and 52 years; all were right-handed, had no history of illness or surgery in the head and skull areas, and participated in this research voluntarily. Before the experiment, it was ensured that participants had not consumed drugs related to neurological and psychiatric disorders, brain diseases, analgesics and caffeinated drugs. Furthermore, they were expected to have had enough sleep and avoid drinking alcohol or caffeinated drinks (coffee, tea, chocolate, cola, etc.). They had not previously participated in any research related to brain waves. This study used non-random (selective) sampling of available subjects.
Study procedure
Electroencephalogram (EEG)
We conducted brain wave measurements using a 24-channel eWave EEG device (model D0324BU, Science Beam Company, China). The device, equipped with high-durability pure silver electrodes, offers wireless recording capabilities. The advantage of wireless recording is reduced noise due to the lack of a power cable connection during recording. The sampling rate chosen for this experiment was 500 Hz. This study was conducted based on the international 10-20 system of electrode placement recommended by the International Federation of Societies for EEG and clinical neurophysiology international federation of societies for EEG and clinical neurophysiology (IFSECN).
Video presentation
The video included 6 native advertisements compiled into a single 8 minutes and 29 seconds film, separated by 5-second white screen intervals. The top native advertisements were selected based on rankings from websites and YouTube, the opinions of supervisors, neurology and cognitive science experts from Guilan University of Medical Sciences, Rasht City, Iran and designers and experts from leading advertising companies in Iran.
Questionnaire
The questionnaire used in this study consists of two sections. The first section contains questions to measure demographic variables, while the second section includes 16 questions related to the components of native advertisements (quality and attractiveness of content) and their impact on cognitive indicators. The questionnaire examines the components of attractiveness and content quality in terms of creativity, graphic design, informativeness, logical and emotional aspects of the content, and the impact of these factors on the audience’s attitudes. A 5-point Likert scale (1=very low to 5=very high) was used in the questionnaire.
Attitude toward web advertisements is a general tendency to like or dislike advertising messages [16]. An effective advertisement can influence consumer attitudes and lead to behavioral responses [17]. Therefore, given the importance of attitude in designing effective and impactful advertisements, this study examined this variable.
The cronbach α coefficient was calculated to determine the reliability of the questionnaire. The calculated alpha coefficient for the study variables was 0.807, indicating sufficient reliability of the questionnaire. Content validity was used to determine the validity of the questionnaire. The designed questionnaire was presented to 10 professors and marketing experts for content validity confirmation. Since the minimum value needed to establish content validity based on the opinions of 10 experts is 0.62 according to the CVR index and 0.79 according to the CVI index, all items with values lower than 0.62 and 0.79 were omitted from the questionnaire.
To conduct the experiment, participants were asked to visit the Trauma Research Center at Guilan University of Medical Sciences to have their brain waves recorded. Initially, the volunteer sat in a comfortable chair facing a laptop screen and then details about the experiment, the device’s safety, how they should cooperate, and the inability of the device to disclose individuals’ mental information were explained. All participants signed a consent form before the experiment began.
After these preparations, the subject was asked to minimize joint, neck and eye movements during the experiment while brain wave data was being recorded, as these movements could affect the muscle signals received.
The channels examined in this study include the electrodes Fp1, Fp2, F3, F7, F4 and F8, as shown in Figure 1, which are placed in the frontal and prefrontal areas.
 The reference electrodes were attached to the participants’ ears and the device’s hardware filters were set as a high-pass filter with a cutoff frequency of 1 Hz and a low-pass filter with a cutoff frequency of 40 Hz.
Initially, the participants were asked to look at a blank white screen with their eyes open to establish a baseline of brain activity in a resting state, and their baseline EEG signals were recorded during this period. Following this, participants watched the advertisement video. This setup was designed to analyze the differences in brain activity between the resting state without external noise and the exposure to native advertisements. The changes in the brain’s electrical responses were used to compare brain activity in the resting state with the activity when exposed to stimuli, allowing for the assessment of specific brain functions related to the stimuli.
After recording the brain waves, participants were asked to complete a 16-question questionnaire about the features of the displayed native advertisements.
The brain wave data and the questionnaire responses were analyzed and interpreted, and the results were compared. The recorded brain wave data were stored using eLife software and the raw EEG data underwent preprocessing to remove artifacts and noise from eye blinks, eye movements and muscle movements using NeuroGuide software, version 2.9.6.1 and MATLAB software, version 2024. The EEG data were then converted to numerical values using MATLAB software, version 2024 (The Mathworks, Inc.) and the open-source EEGLAB toolbox software, version 2024. In PSD, theta (4–8 Hz), alpha (8–13 Hz) and beta (14–30 Hz) frequency bands were extracted and the average signal power was calculated. Descriptive and inferential statistics methods, including the Wilcoxon test and correlation, were conducted using SPSS software, version 26 for data analysis.
Results
The Kolmogorov-Smirnov test indicated that most of the data did not follow a normal distribution, thus leading to non-parametric tests for further analysis.
In the first section, brain wave activity during the resting state was compared while watching the advertisement. Then, in the second section, the relationship between brain wave activity and the participants’ self-reported responses was examined. In the statistical tests of this study, a P<0.05 indicates statistical significance, while a P>0.05 indicates a lack of statistical significance.
Brain activity analysis in resting state and stimulus state
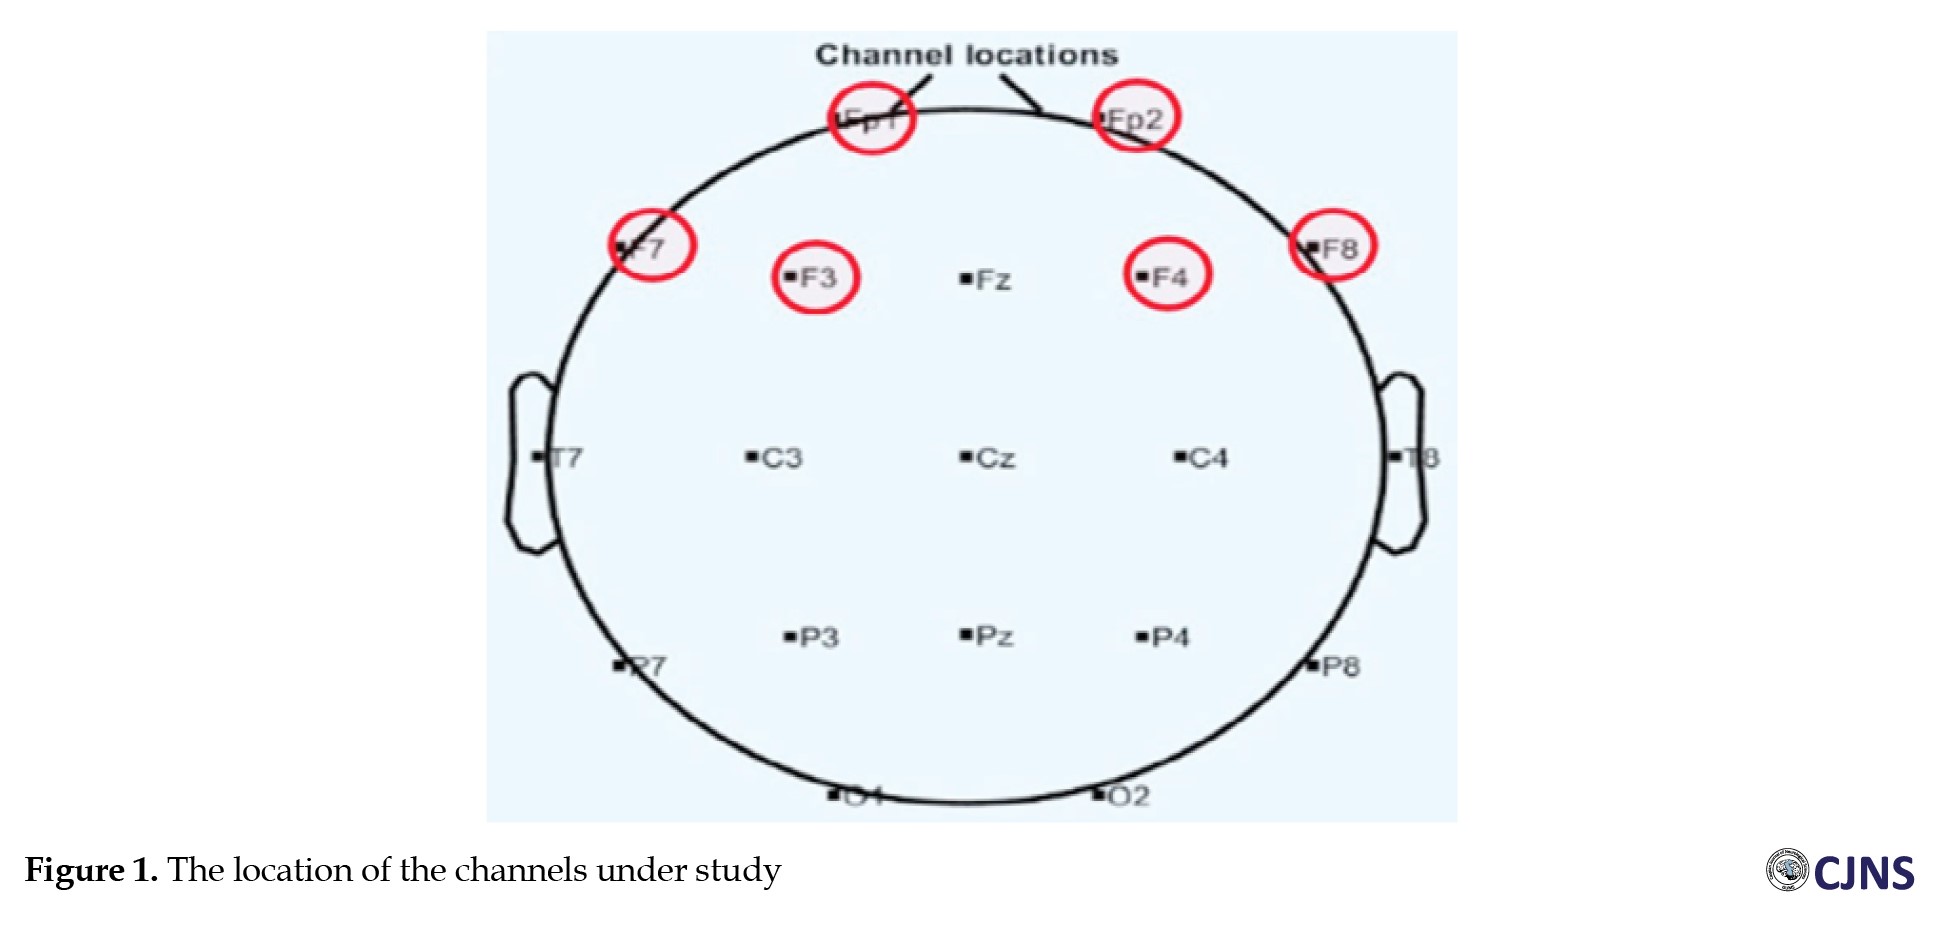
Table 1 compares the average PSD of theta wave in the resting and stimulus states.
The average PSD of the theta wave activity decreased across all channels while watching the advertisement compared to the resting state. The analysis of the average PSD of theta wave activity changes indicated a significant difference only in the F4 channel (P<0.05). This finding suggests a statistically significant difference in the average PSD of theta wave activity between this specific channel’s resting state and the stimulus state. No significant differences were observed between the resting state and the stimulus state in other channels (Fp1, Fp2, F3, F7, F8).
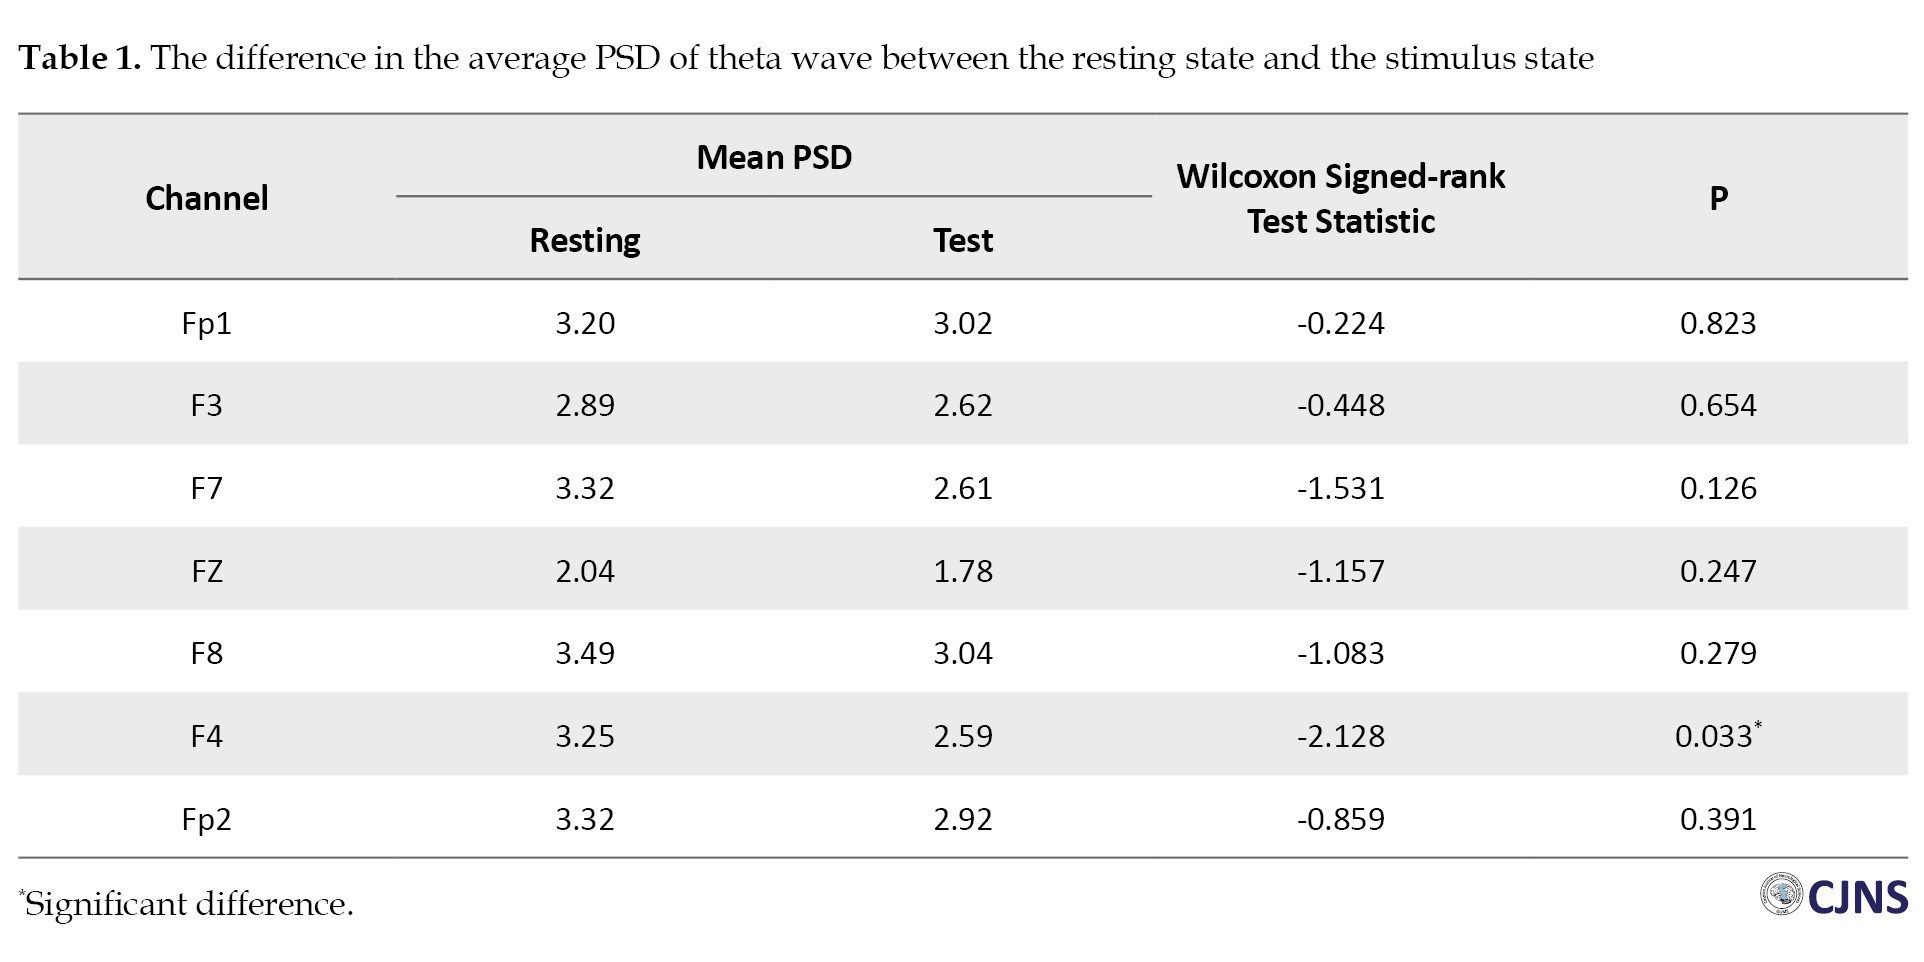
Table 2 compares the average PSD of the alpha wave in the rest and stimulus states.
The results showed no significant difference between the rest and stimulus states in any channel (P>0.05).
Table 3 compares the average PSD of the beta wave in the resting and stimulus states.
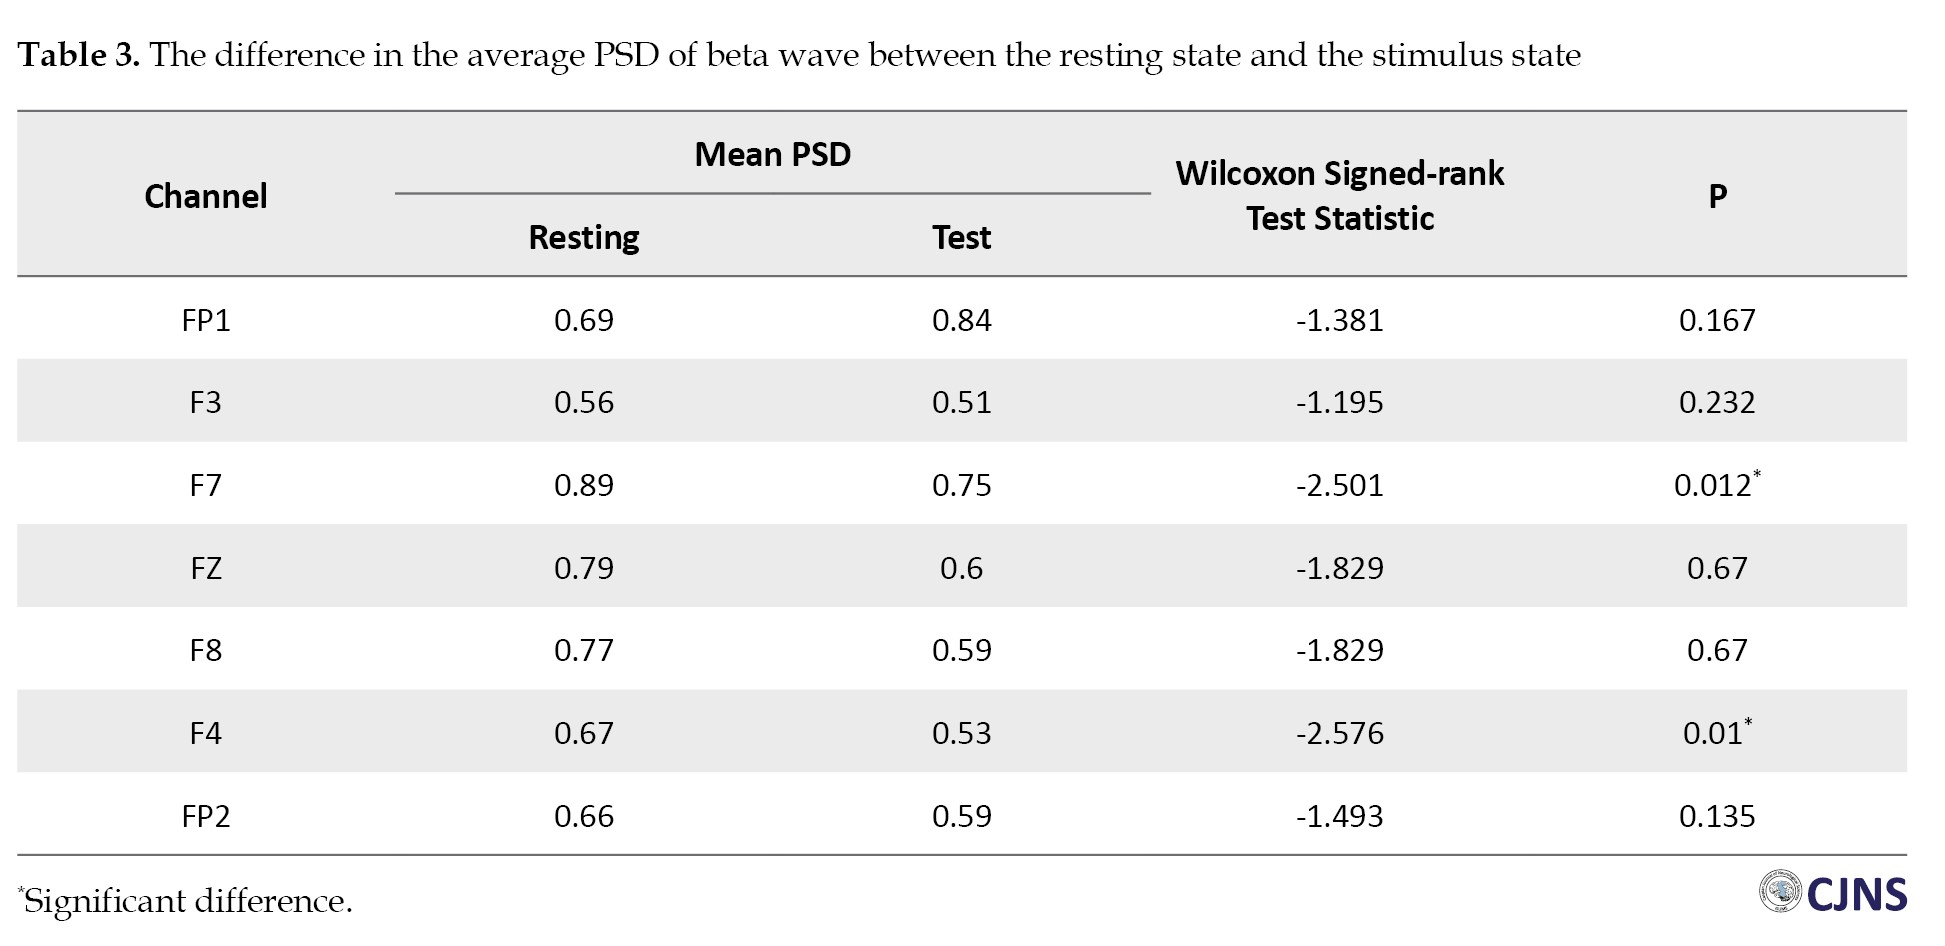
The average PSD of beta wave activity decreased across all channels while watching the advertisement compared to the resting state. The Wilcoxon test results indicated a significant difference in channels F4 and F7 (P<0.05). This outcome suggests a statistically significant difference in the average PSD of beta wave activity between the resting state and the Stimulus State for this specific channel. For other channels (Fp1, Fp2, F3, F8), no significant differences in the average PSD of beta wave activity were observed between the resting state and the stimulus state.
Figures 2 and 3 correspond to one of the participants in the study and depict the distribution of absolute power of brain waves (FFT absolute power) in the theta, alpha, and beta frequency bands.
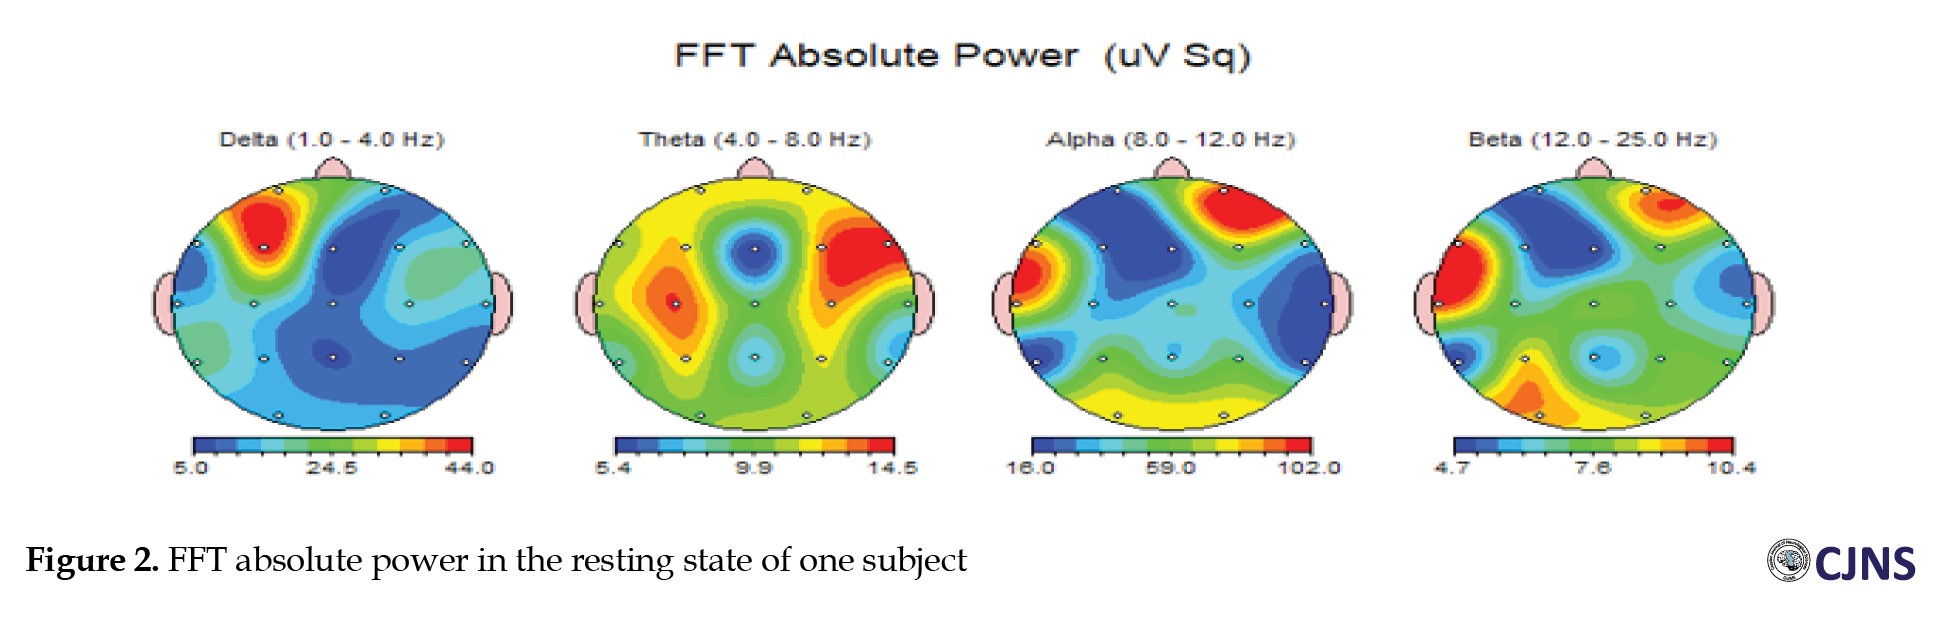
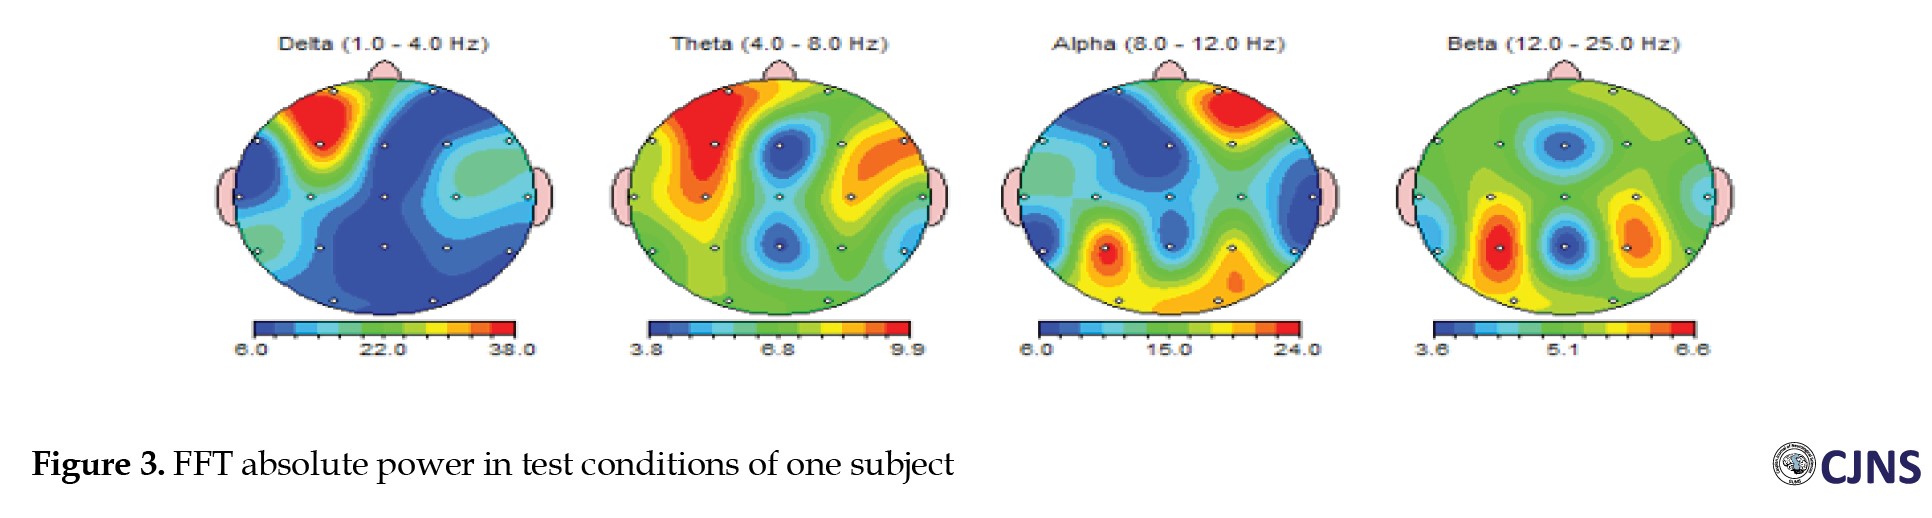 Figure 2 illustrates the participant’s brain activity in the resting state, while Figure 3 shows their brain activity during the stimulus state. This comparison shows the changes induced by the stimulus across different brain regions.
Comparing the neural responses of the brain and self-report
The main question in this section is whether a significant relationship exists between the self-report (questionnaire) and the brain’s neural responses PSD. To examine the correlation and relationship between the components of effective native advertising and the average PSD of brain waves, given that the data obtained from the questionnaire are normal and the data from brain waves are non-normal, the Spearman correlation test was used.
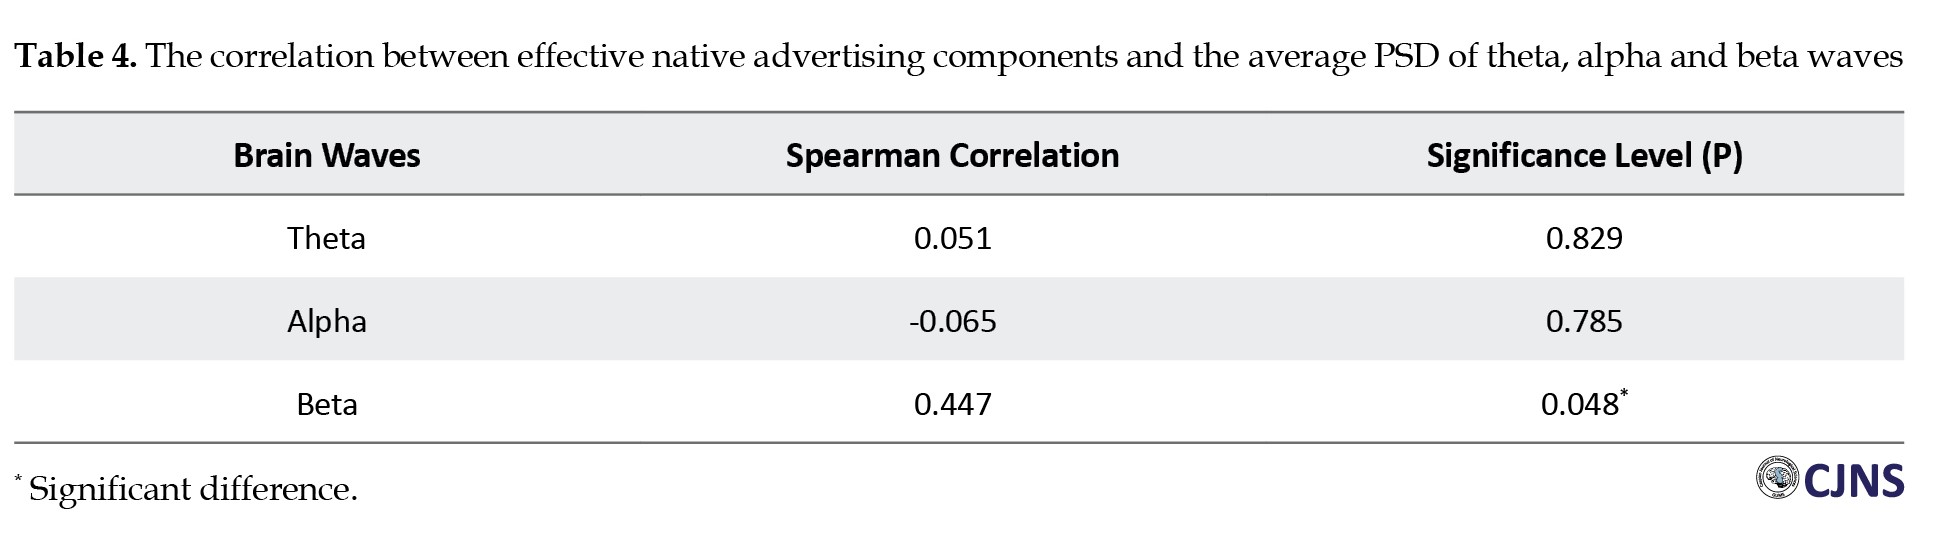
In Table 4, the results of the correlation between the components of effective native advertising and theta, alpha, and beta waves are shown.
The significance levels indicate the presence or absence of meaningful relationships. As shown in Figure 4, the Spearman correlation scatter plot illustrates the relationship between effective native advertising components and the average PSD of beta waves.
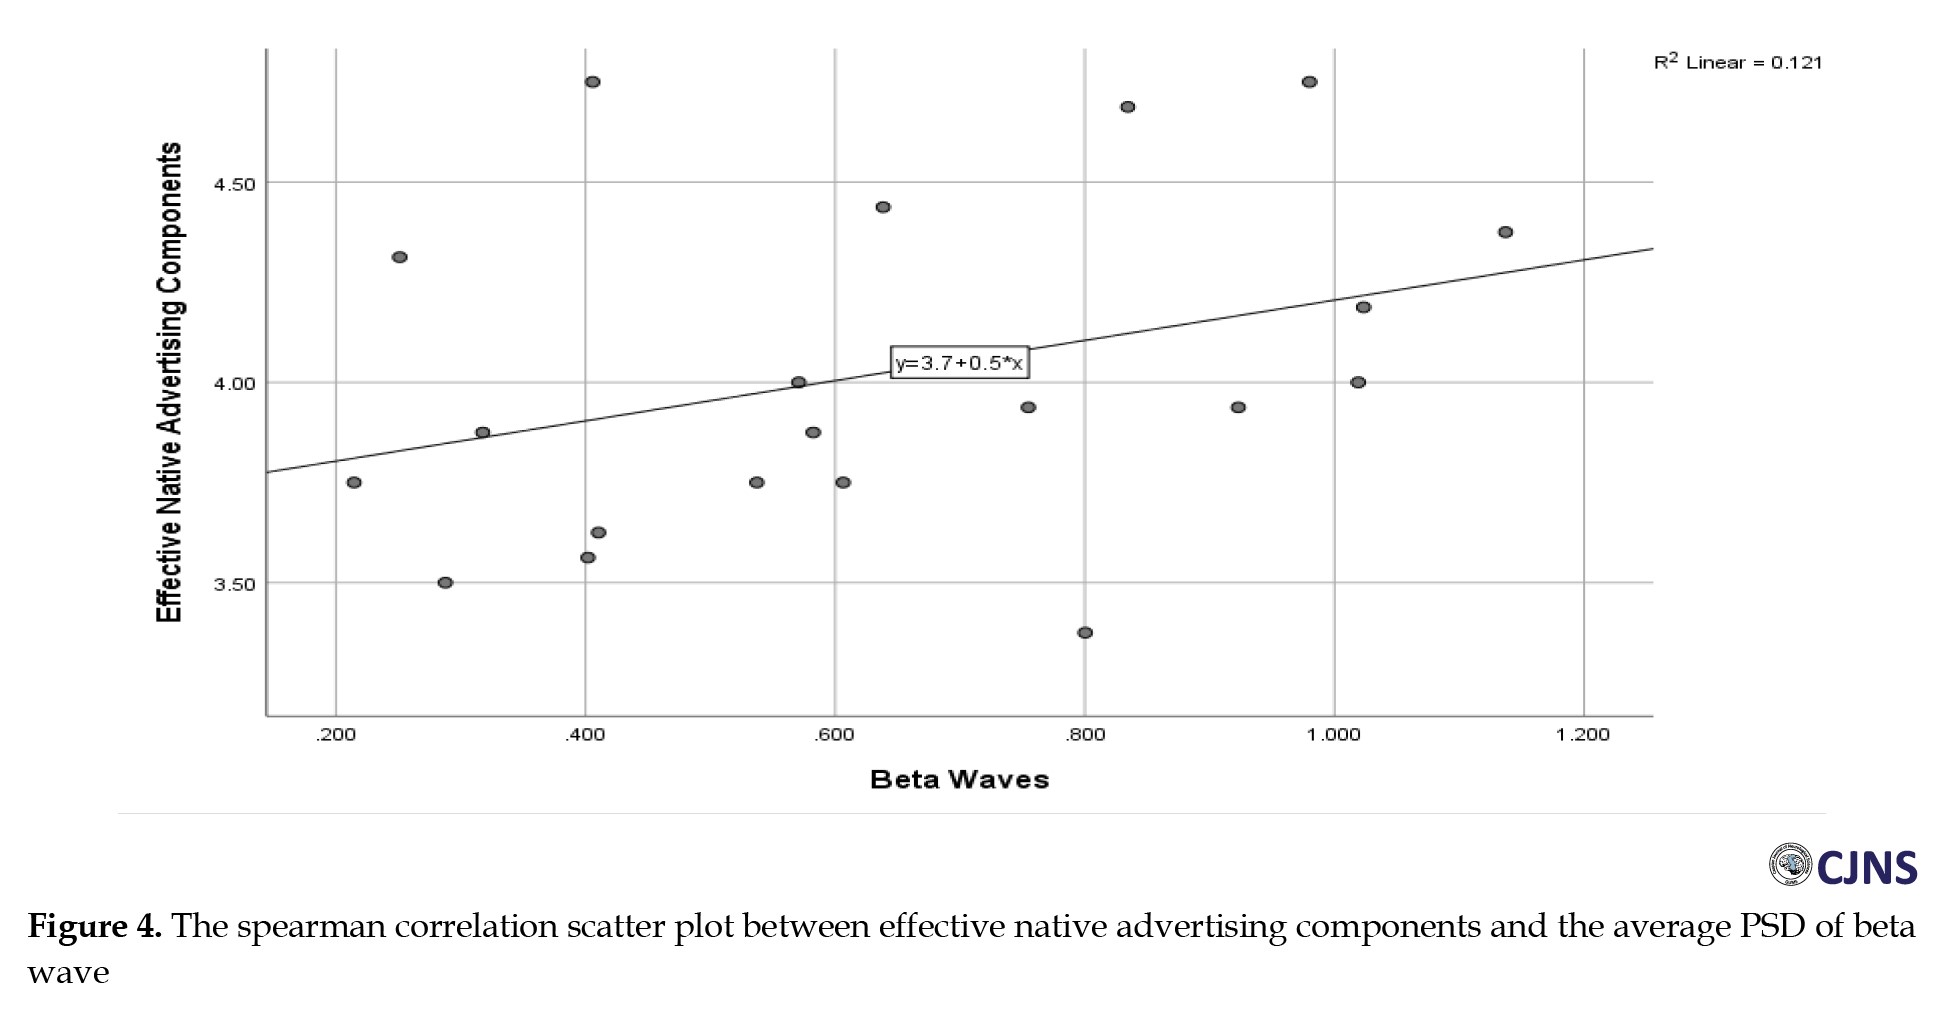 This plot highlights the strength and direction of the correlation observed in the study.
Table 4 shows no significant correlation between the components of effective native advertising and the average PSD of theta or alpha waves (P>0.05). However, with a correlation coefficient of 0.447, there is a positive and significant correlation between the components of effective native advertising and the average PSD of beta waves (P<0.05).
According to Table 5, there is an interpretation of the relationships between the average PSD of brain wave activity in different channels and attitudes, as measured by the Spearman correlation coefficient and significance coefficient.
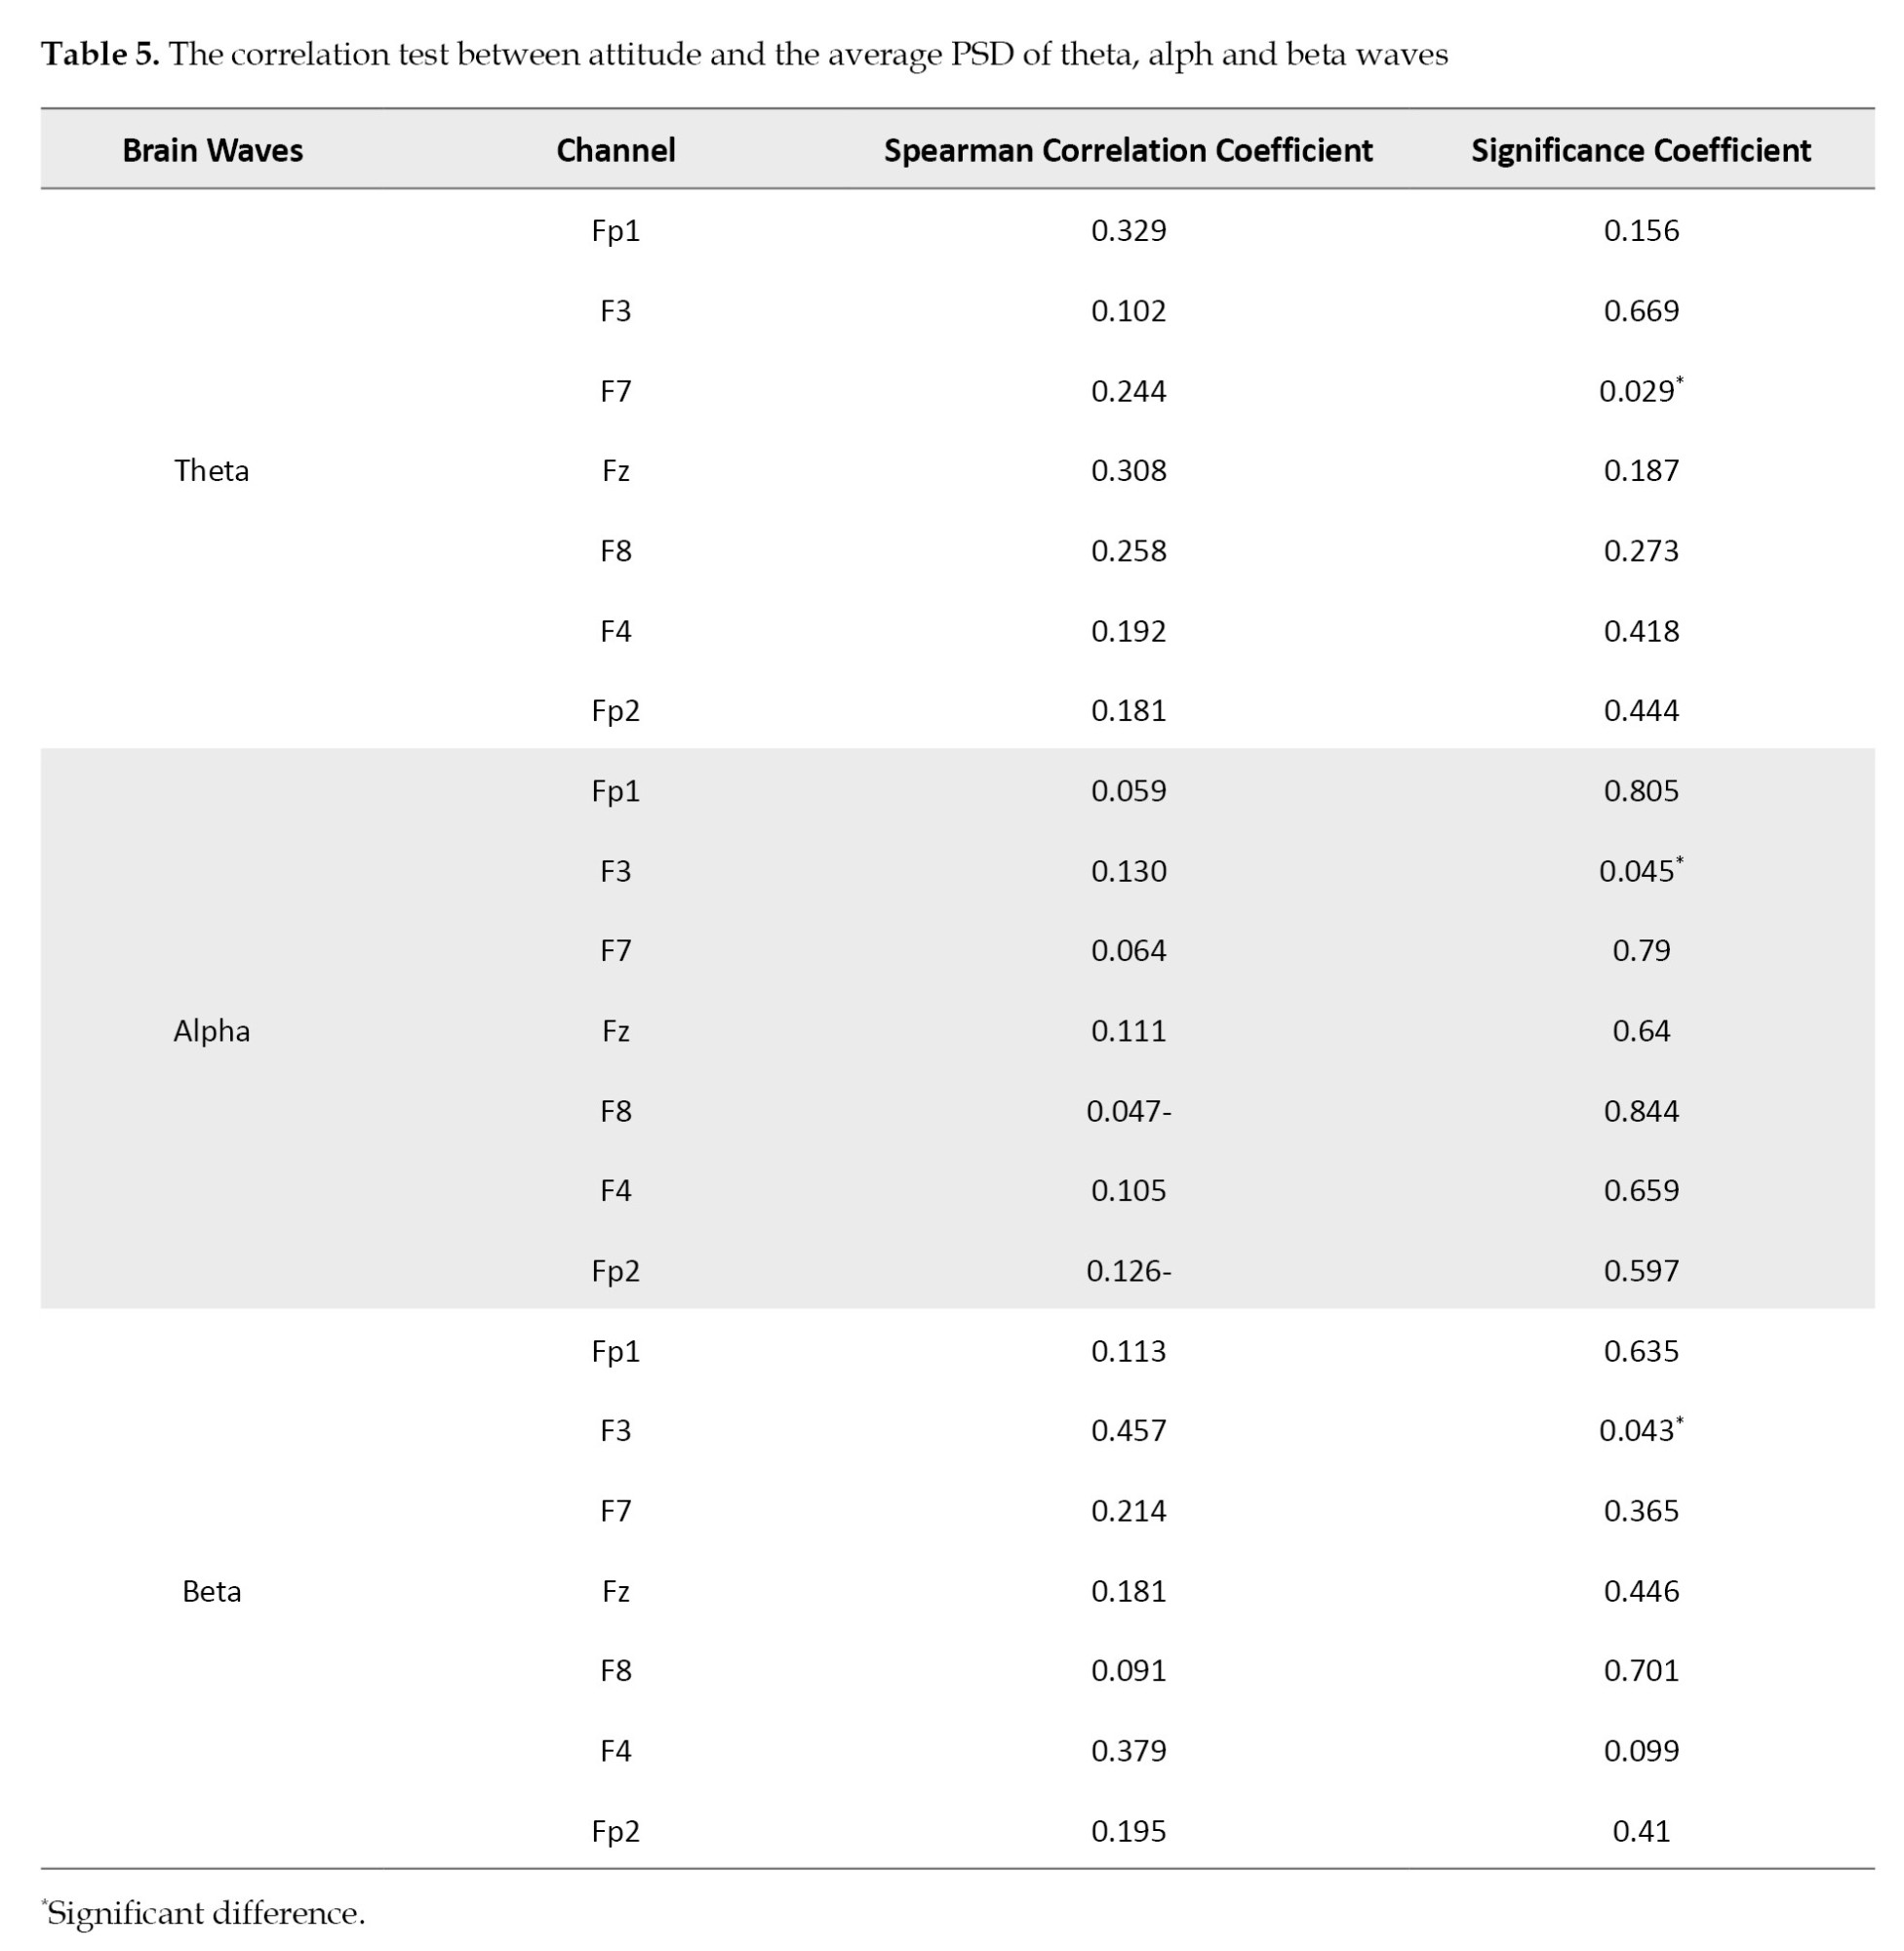
Table 5 shows the significant relationship between the average PSD of the F7 theta wave channel and attitude (P<0.05). The correlation coefficient (0.244) indicates that the correlation between the variables is positive and significant. Additionally, the relationship between the F3 Alpha wave channel and attitude is less than 0.05, indicating a significant relationship between the average PSD of the F3 Alpha wave channel and attitude is significant (P<0.05). The correlation coefficient of 0.130 indicates that the correlation between the variables is positive and significant. Furthermore, the relationship between the average PSD of the F3 beta wave channel and attitude is significant (P<0.05). The correlation coefficient of 0.457 indicates that the correlation between the variables is positive and significant. The relationships were not statistically significant for all other channels and wave types, indicating no significant correlation between those channels and attitude.
Discussion
Comparing the average PSD of brain wave activity between the resting state and exposure to effective advertisements
Thanks to neuromarketing, it is possible to measure physiological changes (using neuromarketing instruments) and decode the emotional or cognitive response. Therefore, the neural responses of a consumer’s brain to an advertising campaign can be studied by monitoring the physiological changes produced while watching the ad and analyzing the emotions that caused these changes [18]. The cortical activity of the frontal regions performs better in attitude detection than other brain areas [19]. Vecchiato et al. demonstrated that pleasant and unpleasant advertisements would increase theta and alpha activity in different brain hemispheres. In neuromarketing, the asymmetry of alpha activity in the frontal brain region has been utilized to examine factors such as liking, attractiveness, and the prediction of purchase decisions. The results indicate that a preference for liking enhances theta band power in the left frontal region, whereas a preference for disliking increases theta band power in the right frontal region [20]. Negative and positive emotions increase the activity of alpha, beta, and theta bands in the frontal and prefrontal areas of both the right and left hemispheres. A decreased alpha power in the frontal and prefrontal regions leads to increased visual attention [21]. It is believed that sustained beta power is linked to memory formation for visual stimuli, and an increase in beta power may enhance attention and cognitive activity [22].
The comparison of the average PSD of the theta wave in the resting state and the stimulus state indicates that the average theta wave power decreases in all channels while watching the advertisement compared to the resting state. However, the average theta wave power changes show a significant difference only in the F4 channel (P<0.05). Specifically, the PSD in the F4 channel decreases from 3.25 in the resting state to 2.59 in the stimulus state, which reflects a statistically significant difference in the average theta wave power for this particular channel. The comparison of the average PSD of the alpha wave in the resting state and the stimulus state shows no significant difference between the resting state and the stimulus state in any of the channels (P>0.05). In comparing the average PSD of beta waves, a decrease in the average power was observed across all channels. Specifically, the average power of beta waves decreased from 0.89 to 0.75 in the F7 channel and 0.67 to 0.53 in the F4 channel, showing significant differences (P<0.05).
No research has been conducted on the components discussed in this study, so comparison with previous research is impossible. However, a similar research conducted by Khushaba et al. (2013) found comparable results for the theta wave. Their results for the alpha wave differed from those of the present study. The absolute power has increased across all waves. Their findings showed a clear and significant change in the spectral power activities of the delta, alpha, and beta brain waves when exposed to advertisements, mainly in the frontal area [22]. Another study by Darabi et al. (2018) focused on four groups of athletes and non-athletes, both interested and uninterested in the Nike brand. The average absolute power of beta waves decreased in the groups of men and women interested in the brand during the advertisement. However, it increased in the groups of men and women who were uninterested in the brand [23].
Additionally, the average absolute power of alpha waves in uninterested men and women did not show a significant difference before and during the advertisement, which is consistent with the current study’s findings. However, the average absolute power of alpha waves increased during the advertisement in the interested men and women, which does not agree with the current study’s results. The average absolute power of theta waves increased in all groups during the advertisement, which does not align with the current study’s findings. Based on the processing and analysis of the signals, they concluded that advertisements increased analytical and focused thinking and arousal, playing a significant role in decision-making [23]. A study in Iran by Ghasemi Siani et al. disagreed with the findings of this part of the present research and yielded opposite results. The alpha waves showed a significant difference in the post-test phase (viewing logical and emotional images) compared to the pre-test phase (viewing a blank screen) [24].
The differences and similarities observed in the results of previous studies compared to the current study may arise from several reasons. The type of samples (e.g. athletes vs non-athletes, individuals interested vs non-interested in a particular brand) can significantly impact the results. Brand preference or individuals’ lifestyle types may influence their brain responses to advertisements. For instance, in the study by Darabi et al. (2018), the preference for the Nike brand in different groups led to different results, which could be an important factor in the observed differences. The nature and appeal of the advertisement content can also affect brain responses. Advertisements with strong emotional or visual content may evoke different brain reactions than logical or simpler ads [23].
Differences in advertisement content in various studies may lead to differing results in brainwave activity. Variations in the participants’ cognitive involvement and attention levels in different studies might cause variations in brainwave activity results. In studies where participants are highly engaged with the advertisement content, a greater reduction in alpha wave activity is usually observed, indicating increased attention. These differences could stem from variations in the type of advertisement, brand preference, or the participants’ motivation. Additionally, differences in experimental phases (pre-test, advertisement viewing and post-test), the duration of advertisement viewing, and environmental conditions may influence the results.
The results showed that the absolute power of theta and beta waves in certain frontal regions of the brain changed noticeably when exposed to the advertisement, which may indirectly be related to cognitive or attentional changes caused by the advertising stimulus. Alpha waves are typically associated with a state of relaxation and mental focus and the lack of significant changes in this wave may indicate that the advertisement had no strong impact on this type of brain activity. At the same time, some previous studies have shown that advertisements can affect alpha wave activity.
The relationship between the average PSD of neural responses of the brain and self-report
Marketers often rely on questionnaires and focus groups to understand consumer habits and attitudes. However, these methods can yield inaccurate results due to their heavy reliance on consumer judgments. Neuromarketing, by using neural and physiological measurements, studies the unconscious processes of the brain that occur when consumers evaluate products [10]. This section examined the relationship between the components of effective advertisements (quality and attractiveness of content) and the changes in the average PSD of brain waves. Regarding the relationship between the components of effective advertisements and brain activity, it was observed that the relationship between the effective advertisement components and the average PSD of the beta wave is positive and significant, with a correlation coefficient of 0.447. This finding implies that viewing effective advertisements increases beta wave activity. A study by Izadkhah and Yahyayi on the conscious and unconscious behavior of children consuming animation found a significant difference between children’s conscious responses to questionnaires and unconscious brain activity [25]. Alsakaa et al. (2020) conducted research using advertisements for dietary supplements that enhance cognitive abilities. They divided the study into two phases: One two months before exams and the other during the exam period. They aimed to determine whether students show more interest in the advertisement during exams (at the “right” time) and whether neurometric indices can capture such interest by demonstrating statistically significant differences between these two periods. Participants in the experiment watched a 20-minute film with three commercial breaks. Each break included three 30-second commercial video clips. During the film EEG, heart rate and galvanic skin response data were collected from the participants. After watching the film, participants filled out a questionnaire regarding the content they had just seen, providing evaluations of the advertisements on a scale from 1 (negative) to 10 (positive). The results of the neurometric data showed significant differences in advertisement reception. Specifically, the viewers’ response was better when the advertisement was broadcast when the product was needed. However, the questionnaires conducted alongside the experiment did not reveal statistically significant differences between participants who watched the advertisement before and during the exam period [26]. In a quasi-experimental study, Eijlers asked participants to watch videos with content ranging from action, comedy, crime, horror and romance, among others. Brain activity data were recorded while participants watched the videos. After recording the brain waves, the participants were asked to complete a questionnaire related to the videos, designed to validate the effectiveness of the videos. They indicated the extent to which they felt happiness, sadness, fear, and disgust during the viewing. The participants’ emotional responses aligned with the emotions they predominantly experienced while watching the videos [27].
Examining the relationships between the average absolute PSD of brain waves and attitude showed significant correlations in specific channels. The relationship between the average PSD of the F7 channel in the theta wave and attitude is significant (P<0.05), with a correlation coefficient of 0.244, indicating a positive correlation. Similarly, the relationship between the average PSD of the F3 channel in the alpha wave and attitude is significant (P<0.05), with a correlation coefficient of 0.130, reflecting a positive but weaker correlation. Notably, the strongest relationship is observed between the average PSD of the F3 channel in the beta wave and attitude (P<0.05), with a correlation coefficient of 0.457, suggesting a positive and more substantial impact. These findings demonstrate that the activity of brain waves in specific channels, particularly the beta wave in the F3 channel, plays a significant role in shaping attitudes.
The core elements of advertising effectiveness include the attitude toward the advertisement, intention and actual behavior. Research has shown that attitude toward advertisements is significantly related to advertising effectiveness because attitude drives behavior [17]. Stasi et al. in a study entitled “neuromarketing approach and food choice,” stated that the lower the alpha level in the frontal area, the higher the engagement and cognitive load in this part of the brain [28]. Farzi et al. in an article entitled “The Impact of Identification with an athlete on changing attitudes towards commercial advertisements of famous athletes using neuromarketing techniques,” focused on determining the effect of identification with an athlete on attitudes towards commercial advertisements of famous athletes using neuromarketing techniques. Their results showed that the average brain power of participants in the temporal area was higher in the high-identification group. The frontal area was higher in the low-identification group, with Fp2 showing more activity in all samples [29]. Designing advertising campaigns can sometimes be challenging because audiences may have positive and negative attitudes toward a particular subject. The more ambivalent the attitudes, the less likely the intention to change behavior. Therefore, it is better to use neuromarketing tools to examine unconscious cognitive or motivational processes [30].
Conclusion
The increase in the average absolute PSD of the beta wave in the Fp1 channel indicates greater attention and more active information processing in the left hemisphere, typically associated with more complex cognitive activities, information processing, and heightened attention. The decrease in the average absolute PSD of alpha and theta waves reflects increased attention and concentration. However, the reduction in the average absolute PSD of beta wave (except for the Fp1 channel), as well as theta and alpha waves, may indicate that the advertisement caused changes in the average absolute PSD of brain waves but was not sufficiently effective in capturing viewers’ attention or evoking a strong emotional response.
In comparing the conscious mind and the neural responses of individuals’ brains to the components of native advertising (attractiveness and content quality), the results showed that a significant relationship was found only in the average absolute PSD of the beta wave, which was positive and significant. The positive relationship between the impact of effective native advertising on individuals’ attitudes (self-reports) and changes in the spectral power density of brain waves (neural responses) when exposed to effective native advertisements in the F7 theta wave channel and the F3 alpha and beta wave channels (left hemisphere) showed that, in positive emotions, the brain’s neural responses to advertisements may agree with individuals’ self-reports.
Study limitations
The experiment was conducted offline without being embedded within a specific platform context. Given that participants tend to focus more compared to when they are browsing news websites, it is recommended that future researchers use online native advertising in their experiments. Neuromarketing is an interdisciplinary field requiring marketing, neuroscience, and psychology expertise. Therefore, the lack of access to experts who can understand and integrate these three disciplines increased the research process’s complexity and duration. Hence, researchers are advised to conduct their work within companies or institutions with access to proficient neuromarketing specialists in all three areas.
Ethical Considerations
Compliance with ethical guidelines
This study was approved by the Research Ethics Committee of Islamic Azad University, Rasht Branch (Code: IR.IAU.RASHT.REC.1401.027). All participants were informed about the study objectives and the voluntary nature of participation.
Funding
This research was extracted from the doctoral dissertation of Mina Montakhab Madani, approved by Islamic Azad University, Rasht Branch (Code: 1174825945237041400162407006).
Authors contributions
All authors contributed equally to the conception and design of the study, data collection and analysis, interpretation of the results and drafting of the manuscript. Each author approved the final version of the manuscript for submission.
Conflict of interest
The authors declared no conflict of interest.
Acknowledgements
The authors thank Afshin Dalili, Fariba Biyouki, Leila Kouchakinejad-Eramsadati, Nooshaz Amirahmadi Chomachar and Sara SharifNia for their tremendous experiment assistance.
References
Advertising is key to embedding a company’s name in customers’ minds. Therefore, organizations must implement it effectively. Today, due to increased advertising avoidance, publishers have been forced to seek new ways to monetize their digital content. One solution to this challenge has been native advertising [1]. Native advertising is a type of advertisement that blends with the content of the platform where it appears, making it sometimes indistinguishable from other content [2]. Meeting customer expectations and identifying the factors influencing purchasing decisions are crucial in developing successful marketing and advertising strategies [3]. Evaluating effectiveness reveals limitations as it relies on the client’s willingness and ability to articulate their feelings when exposed to advertisements [4]. Various methods and tools have been employed to gain deeper insights into consumer behavior and the impact of advertising messages. However, these approaches have inherent limitations and significant biases, making it impossible to understand consumer thought processes fully [5]. Cognitive processes involve many subconscious elements. Methods like “articulated answers,” including market research, surveys and focus groups, are not ideal for understanding an individual’s feelings about a product or service. In focus groups, participants’ responses may be swayed by dominant group opinions and external factors like incentives, time constraints, and pressure, which can affect the results. Similarly, surveys require large sample sizes and carefully designed tools to account for variables such as language, education and cultural differences among the participants [4]. In-depth interviews are valuable for understanding consumers’ perspectives, attitudes and value judgments. However, they are often subjective, as they depend on self-reported information, which can be biased and challenging to interpret objectively [6]. Neuromarketing offers profound insights into customers’ motivations, preferences, and decisions by analyzing physiological and neural signals and examining their cognitive and emotional responses to marketing stimuli [3]. Neuromarketing is a growing discipline integrating insights from marketing, neuroscience, economics, decision-making theories and psychology [7]. Neuromarketing is a valuable research approach as it leverages neuroscientific theories and techniques to uncover information that would otherwise remain inaccessible. This data is obtained by observing neural processes, bypassing the need to directly question individuals’ thoughts, emotions, memories, evaluations, or decision-making strategies [8]. Neuromarketing enhances the efficiency of marketing processes by analyzing responses to marketing stimuli through techniques like brain imaging and eye tracking without relying on consumer self-reports. It assesses and quantifies mental states, shifts in attention, initial impressions, message recall levels, and the emotional reactions triggered by specific stimuli [9]. Neuromarketing examines consumer thought processes and identifies factors influencing purchasing decisions. It utilizes neural and physiological metrics to explore subconscious brain activity during product evaluation. By eliminating reliance on consumer self-reported answers, this marketing offers valuable insights into consumers’ decision-making processes [10].
The fast fourier transform (FFT) method analyzes brainwave signals. Through mathematical operations, FFT decomposes electroencephalography (EEG) signals into their sinusoidal components (frequency domain representation). This method transforms EEG signals from the time domain to the frequency domain, breaking down the time-domain signals into their constituent frequency components [11]. Most studies on EEG-based emotion recognition highlight the alpha, beta, and occasionally theta frequency bands as the most effective for distinguishing an individual’s emotional state [12]. Changes in brain activity related to emotions and attention occur in the frontal lobe, which is the most active area for the propagation of alpha, beta and theta waves, and are helpful for cognitive processing studies [13].
The current research analyzes theta, alpha, and beta brainwave frequencies. Similar studies to the present research have shown that the most important brain regions responsible for decision-making and preferences (such as liking or disliking) are the frontal electrodes, mainly F4, F8, F3 and F7. These regions are especially effective in analyzing priorities and the absolute power spectral density (PSD) [13]. Therefore, using neuromarketing techniques and tools alongside traditional methods can be a practical step in enhancing the effectiveness of advertising strategies. An effective advertisement can capture the audience’s attention, create a memorable impact, stimulate the audience’s purchasing behavior, and awaken the audience’s sensory perception [14].
Examining users’ reactions after encountering and understanding a message as an advertisement is a prerequisite for this research. This research aims to study users’ brain waves before and during the viewing of native advertising and to examine the relationship between neural responses of the brain and self-report. Therefore, this research seeks to answer the following questions: Is there a significant difference in the absolute power of brainwaves between the two states of rest and exposure to effective native advertising? Is there a significant relationship between neural responses of the brain and self-report?
Materials and Methods
This research focuses on analyzing the average PSD for specific frontal channels of the brain. The right frontal channels (Fp2, F4, F8) and the left frontal channels (Fp1, F3, F7) have been selected due to their significant roles in decision-making and preference formation processes.
Participants and sample size
Neuromarketing studies are conducted with small sample sizes due to the complexity of the experiments. At least 15 to 20 participants are required for such studies. The findings from these studies can be generalized because brain mechanisms are similar among individuals [15]. Numerous neuroscience studies, including Hsu and Chen [7], have adopted this approach. A total of 20 participants successfully passed the initial selection and proceeded to participate in this study. The sample consists of 10 men and 10 women from the staff and students of Guilan University of Medical Sciences, aged between 19 and 52 years; all were right-handed, had no history of illness or surgery in the head and skull areas, and participated in this research voluntarily. Before the experiment, it was ensured that participants had not consumed drugs related to neurological and psychiatric disorders, brain diseases, analgesics and caffeinated drugs. Furthermore, they were expected to have had enough sleep and avoid drinking alcohol or caffeinated drinks (coffee, tea, chocolate, cola, etc.). They had not previously participated in any research related to brain waves. This study used non-random (selective) sampling of available subjects.
Study procedure
Electroencephalogram (EEG)
We conducted brain wave measurements using a 24-channel eWave EEG device (model D0324BU, Science Beam Company, China). The device, equipped with high-durability pure silver electrodes, offers wireless recording capabilities. The advantage of wireless recording is reduced noise due to the lack of a power cable connection during recording. The sampling rate chosen for this experiment was 500 Hz. This study was conducted based on the international 10-20 system of electrode placement recommended by the International Federation of Societies for EEG and clinical neurophysiology international federation of societies for EEG and clinical neurophysiology (IFSECN).
Video presentation
The video included 6 native advertisements compiled into a single 8 minutes and 29 seconds film, separated by 5-second white screen intervals. The top native advertisements were selected based on rankings from websites and YouTube, the opinions of supervisors, neurology and cognitive science experts from Guilan University of Medical Sciences, Rasht City, Iran and designers and experts from leading advertising companies in Iran.
Questionnaire
The questionnaire used in this study consists of two sections. The first section contains questions to measure demographic variables, while the second section includes 16 questions related to the components of native advertisements (quality and attractiveness of content) and their impact on cognitive indicators. The questionnaire examines the components of attractiveness and content quality in terms of creativity, graphic design, informativeness, logical and emotional aspects of the content, and the impact of these factors on the audience’s attitudes. A 5-point Likert scale (1=very low to 5=very high) was used in the questionnaire.
Attitude toward web advertisements is a general tendency to like or dislike advertising messages [16]. An effective advertisement can influence consumer attitudes and lead to behavioral responses [17]. Therefore, given the importance of attitude in designing effective and impactful advertisements, this study examined this variable.
The cronbach α coefficient was calculated to determine the reliability of the questionnaire. The calculated alpha coefficient for the study variables was 0.807, indicating sufficient reliability of the questionnaire. Content validity was used to determine the validity of the questionnaire. The designed questionnaire was presented to 10 professors and marketing experts for content validity confirmation. Since the minimum value needed to establish content validity based on the opinions of 10 experts is 0.62 according to the CVR index and 0.79 according to the CVI index, all items with values lower than 0.62 and 0.79 were omitted from the questionnaire.
To conduct the experiment, participants were asked to visit the Trauma Research Center at Guilan University of Medical Sciences to have their brain waves recorded. Initially, the volunteer sat in a comfortable chair facing a laptop screen and then details about the experiment, the device’s safety, how they should cooperate, and the inability of the device to disclose individuals’ mental information were explained. All participants signed a consent form before the experiment began.
After these preparations, the subject was asked to minimize joint, neck and eye movements during the experiment while brain wave data was being recorded, as these movements could affect the muscle signals received.
The channels examined in this study include the electrodes Fp1, Fp2, F3, F7, F4 and F8, as shown in Figure 1, which are placed in the frontal and prefrontal areas.
Initially, the participants were asked to look at a blank white screen with their eyes open to establish a baseline of brain activity in a resting state, and their baseline EEG signals were recorded during this period. Following this, participants watched the advertisement video. This setup was designed to analyze the differences in brain activity between the resting state without external noise and the exposure to native advertisements. The changes in the brain’s electrical responses were used to compare brain activity in the resting state with the activity when exposed to stimuli, allowing for the assessment of specific brain functions related to the stimuli.
After recording the brain waves, participants were asked to complete a 16-question questionnaire about the features of the displayed native advertisements.
The brain wave data and the questionnaire responses were analyzed and interpreted, and the results were compared. The recorded brain wave data were stored using eLife software and the raw EEG data underwent preprocessing to remove artifacts and noise from eye blinks, eye movements and muscle movements using NeuroGuide software, version 2.9.6.1 and MATLAB software, version 2024. The EEG data were then converted to numerical values using MATLAB software, version 2024 (The Mathworks, Inc.) and the open-source EEGLAB toolbox software, version 2024. In PSD, theta (4–8 Hz), alpha (8–13 Hz) and beta (14–30 Hz) frequency bands were extracted and the average signal power was calculated. Descriptive and inferential statistics methods, including the Wilcoxon test and correlation, were conducted using SPSS software, version 26 for data analysis.
Results
The Kolmogorov-Smirnov test indicated that most of the data did not follow a normal distribution, thus leading to non-parametric tests for further analysis.
In the first section, brain wave activity during the resting state was compared while watching the advertisement. Then, in the second section, the relationship between brain wave activity and the participants’ self-reported responses was examined. In the statistical tests of this study, a P<0.05 indicates statistical significance, while a P>0.05 indicates a lack of statistical significance.
Brain activity analysis in resting state and stimulus state
Table 1 compares the average PSD of theta wave in the resting and stimulus states.
The average PSD of the theta wave activity decreased across all channels while watching the advertisement compared to the resting state. The analysis of the average PSD of theta wave activity changes indicated a significant difference only in the F4 channel (P<0.05). This finding suggests a statistically significant difference in the average PSD of theta wave activity between this specific channel’s resting state and the stimulus state. No significant differences were observed between the resting state and the stimulus state in other channels (Fp1, Fp2, F3, F7, F8).
Table 2 compares the average PSD of the alpha wave in the rest and stimulus states.
The results showed no significant difference between the rest and stimulus states in any channel (P>0.05).
Table 3 compares the average PSD of the beta wave in the resting and stimulus states.
The average PSD of beta wave activity decreased across all channels while watching the advertisement compared to the resting state. The Wilcoxon test results indicated a significant difference in channels F4 and F7 (P<0.05). This outcome suggests a statistically significant difference in the average PSD of beta wave activity between the resting state and the Stimulus State for this specific channel. For other channels (Fp1, Fp2, F3, F8), no significant differences in the average PSD of beta wave activity were observed between the resting state and the stimulus state.
Figures 2 and 3 correspond to one of the participants in the study and depict the distribution of absolute power of brain waves (FFT absolute power) in the theta, alpha, and beta frequency bands.
Comparing the neural responses of the brain and self-report
The main question in this section is whether a significant relationship exists between the self-report (questionnaire) and the brain’s neural responses PSD. To examine the correlation and relationship between the components of effective native advertising and the average PSD of brain waves, given that the data obtained from the questionnaire are normal and the data from brain waves are non-normal, the Spearman correlation test was used.
In Table 4, the results of the correlation between the components of effective native advertising and theta, alpha, and beta waves are shown.
The significance levels indicate the presence or absence of meaningful relationships. As shown in Figure 4, the Spearman correlation scatter plot illustrates the relationship between effective native advertising components and the average PSD of beta waves.
Table 4 shows no significant correlation between the components of effective native advertising and the average PSD of theta or alpha waves (P>0.05). However, with a correlation coefficient of 0.447, there is a positive and significant correlation between the components of effective native advertising and the average PSD of beta waves (P<0.05).
According to Table 5, there is an interpretation of the relationships between the average PSD of brain wave activity in different channels and attitudes, as measured by the Spearman correlation coefficient and significance coefficient.
Table 5 shows the significant relationship between the average PSD of the F7 theta wave channel and attitude (P<0.05). The correlation coefficient (0.244) indicates that the correlation between the variables is positive and significant. Additionally, the relationship between the F3 Alpha wave channel and attitude is less than 0.05, indicating a significant relationship between the average PSD of the F3 Alpha wave channel and attitude is significant (P<0.05). The correlation coefficient of 0.130 indicates that the correlation between the variables is positive and significant. Furthermore, the relationship between the average PSD of the F3 beta wave channel and attitude is significant (P<0.05). The correlation coefficient of 0.457 indicates that the correlation between the variables is positive and significant. The relationships were not statistically significant for all other channels and wave types, indicating no significant correlation between those channels and attitude.
Discussion
Comparing the average PSD of brain wave activity between the resting state and exposure to effective advertisements
Thanks to neuromarketing, it is possible to measure physiological changes (using neuromarketing instruments) and decode the emotional or cognitive response. Therefore, the neural responses of a consumer’s brain to an advertising campaign can be studied by monitoring the physiological changes produced while watching the ad and analyzing the emotions that caused these changes [18]. The cortical activity of the frontal regions performs better in attitude detection than other brain areas [19]. Vecchiato et al. demonstrated that pleasant and unpleasant advertisements would increase theta and alpha activity in different brain hemispheres. In neuromarketing, the asymmetry of alpha activity in the frontal brain region has been utilized to examine factors such as liking, attractiveness, and the prediction of purchase decisions. The results indicate that a preference for liking enhances theta band power in the left frontal region, whereas a preference for disliking increases theta band power in the right frontal region [20]. Negative and positive emotions increase the activity of alpha, beta, and theta bands in the frontal and prefrontal areas of both the right and left hemispheres. A decreased alpha power in the frontal and prefrontal regions leads to increased visual attention [21]. It is believed that sustained beta power is linked to memory formation for visual stimuli, and an increase in beta power may enhance attention and cognitive activity [22].
The comparison of the average PSD of the theta wave in the resting state and the stimulus state indicates that the average theta wave power decreases in all channels while watching the advertisement compared to the resting state. However, the average theta wave power changes show a significant difference only in the F4 channel (P<0.05). Specifically, the PSD in the F4 channel decreases from 3.25 in the resting state to 2.59 in the stimulus state, which reflects a statistically significant difference in the average theta wave power for this particular channel. The comparison of the average PSD of the alpha wave in the resting state and the stimulus state shows no significant difference between the resting state and the stimulus state in any of the channels (P>0.05). In comparing the average PSD of beta waves, a decrease in the average power was observed across all channels. Specifically, the average power of beta waves decreased from 0.89 to 0.75 in the F7 channel and 0.67 to 0.53 in the F4 channel, showing significant differences (P<0.05).
No research has been conducted on the components discussed in this study, so comparison with previous research is impossible. However, a similar research conducted by Khushaba et al. (2013) found comparable results for the theta wave. Their results for the alpha wave differed from those of the present study. The absolute power has increased across all waves. Their findings showed a clear and significant change in the spectral power activities of the delta, alpha, and beta brain waves when exposed to advertisements, mainly in the frontal area [22]. Another study by Darabi et al. (2018) focused on four groups of athletes and non-athletes, both interested and uninterested in the Nike brand. The average absolute power of beta waves decreased in the groups of men and women interested in the brand during the advertisement. However, it increased in the groups of men and women who were uninterested in the brand [23].
Additionally, the average absolute power of alpha waves in uninterested men and women did not show a significant difference before and during the advertisement, which is consistent with the current study’s findings. However, the average absolute power of alpha waves increased during the advertisement in the interested men and women, which does not agree with the current study’s results. The average absolute power of theta waves increased in all groups during the advertisement, which does not align with the current study’s findings. Based on the processing and analysis of the signals, they concluded that advertisements increased analytical and focused thinking and arousal, playing a significant role in decision-making [23]. A study in Iran by Ghasemi Siani et al. disagreed with the findings of this part of the present research and yielded opposite results. The alpha waves showed a significant difference in the post-test phase (viewing logical and emotional images) compared to the pre-test phase (viewing a blank screen) [24].
The differences and similarities observed in the results of previous studies compared to the current study may arise from several reasons. The type of samples (e.g. athletes vs non-athletes, individuals interested vs non-interested in a particular brand) can significantly impact the results. Brand preference or individuals’ lifestyle types may influence their brain responses to advertisements. For instance, in the study by Darabi et al. (2018), the preference for the Nike brand in different groups led to different results, which could be an important factor in the observed differences. The nature and appeal of the advertisement content can also affect brain responses. Advertisements with strong emotional or visual content may evoke different brain reactions than logical or simpler ads [23].
Differences in advertisement content in various studies may lead to differing results in brainwave activity. Variations in the participants’ cognitive involvement and attention levels in different studies might cause variations in brainwave activity results. In studies where participants are highly engaged with the advertisement content, a greater reduction in alpha wave activity is usually observed, indicating increased attention. These differences could stem from variations in the type of advertisement, brand preference, or the participants’ motivation. Additionally, differences in experimental phases (pre-test, advertisement viewing and post-test), the duration of advertisement viewing, and environmental conditions may influence the results.
The results showed that the absolute power of theta and beta waves in certain frontal regions of the brain changed noticeably when exposed to the advertisement, which may indirectly be related to cognitive or attentional changes caused by the advertising stimulus. Alpha waves are typically associated with a state of relaxation and mental focus and the lack of significant changes in this wave may indicate that the advertisement had no strong impact on this type of brain activity. At the same time, some previous studies have shown that advertisements can affect alpha wave activity.
The relationship between the average PSD of neural responses of the brain and self-report
Marketers often rely on questionnaires and focus groups to understand consumer habits and attitudes. However, these methods can yield inaccurate results due to their heavy reliance on consumer judgments. Neuromarketing, by using neural and physiological measurements, studies the unconscious processes of the brain that occur when consumers evaluate products [10]. This section examined the relationship between the components of effective advertisements (quality and attractiveness of content) and the changes in the average PSD of brain waves. Regarding the relationship between the components of effective advertisements and brain activity, it was observed that the relationship between the effective advertisement components and the average PSD of the beta wave is positive and significant, with a correlation coefficient of 0.447. This finding implies that viewing effective advertisements increases beta wave activity. A study by Izadkhah and Yahyayi on the conscious and unconscious behavior of children consuming animation found a significant difference between children’s conscious responses to questionnaires and unconscious brain activity [25]. Alsakaa et al. (2020) conducted research using advertisements for dietary supplements that enhance cognitive abilities. They divided the study into two phases: One two months before exams and the other during the exam period. They aimed to determine whether students show more interest in the advertisement during exams (at the “right” time) and whether neurometric indices can capture such interest by demonstrating statistically significant differences between these two periods. Participants in the experiment watched a 20-minute film with three commercial breaks. Each break included three 30-second commercial video clips. During the film EEG, heart rate and galvanic skin response data were collected from the participants. After watching the film, participants filled out a questionnaire regarding the content they had just seen, providing evaluations of the advertisements on a scale from 1 (negative) to 10 (positive). The results of the neurometric data showed significant differences in advertisement reception. Specifically, the viewers’ response was better when the advertisement was broadcast when the product was needed. However, the questionnaires conducted alongside the experiment did not reveal statistically significant differences between participants who watched the advertisement before and during the exam period [26]. In a quasi-experimental study, Eijlers asked participants to watch videos with content ranging from action, comedy, crime, horror and romance, among others. Brain activity data were recorded while participants watched the videos. After recording the brain waves, the participants were asked to complete a questionnaire related to the videos, designed to validate the effectiveness of the videos. They indicated the extent to which they felt happiness, sadness, fear, and disgust during the viewing. The participants’ emotional responses aligned with the emotions they predominantly experienced while watching the videos [27].
Examining the relationships between the average absolute PSD of brain waves and attitude showed significant correlations in specific channels. The relationship between the average PSD of the F7 channel in the theta wave and attitude is significant (P<0.05), with a correlation coefficient of 0.244, indicating a positive correlation. Similarly, the relationship between the average PSD of the F3 channel in the alpha wave and attitude is significant (P<0.05), with a correlation coefficient of 0.130, reflecting a positive but weaker correlation. Notably, the strongest relationship is observed between the average PSD of the F3 channel in the beta wave and attitude (P<0.05), with a correlation coefficient of 0.457, suggesting a positive and more substantial impact. These findings demonstrate that the activity of brain waves in specific channels, particularly the beta wave in the F3 channel, plays a significant role in shaping attitudes.
The core elements of advertising effectiveness include the attitude toward the advertisement, intention and actual behavior. Research has shown that attitude toward advertisements is significantly related to advertising effectiveness because attitude drives behavior [17]. Stasi et al. in a study entitled “neuromarketing approach and food choice,” stated that the lower the alpha level in the frontal area, the higher the engagement and cognitive load in this part of the brain [28]. Farzi et al. in an article entitled “The Impact of Identification with an athlete on changing attitudes towards commercial advertisements of famous athletes using neuromarketing techniques,” focused on determining the effect of identification with an athlete on attitudes towards commercial advertisements of famous athletes using neuromarketing techniques. Their results showed that the average brain power of participants in the temporal area was higher in the high-identification group. The frontal area was higher in the low-identification group, with Fp2 showing more activity in all samples [29]. Designing advertising campaigns can sometimes be challenging because audiences may have positive and negative attitudes toward a particular subject. The more ambivalent the attitudes, the less likely the intention to change behavior. Therefore, it is better to use neuromarketing tools to examine unconscious cognitive or motivational processes [30].
Conclusion
The increase in the average absolute PSD of the beta wave in the Fp1 channel indicates greater attention and more active information processing in the left hemisphere, typically associated with more complex cognitive activities, information processing, and heightened attention. The decrease in the average absolute PSD of alpha and theta waves reflects increased attention and concentration. However, the reduction in the average absolute PSD of beta wave (except for the Fp1 channel), as well as theta and alpha waves, may indicate that the advertisement caused changes in the average absolute PSD of brain waves but was not sufficiently effective in capturing viewers’ attention or evoking a strong emotional response.
In comparing the conscious mind and the neural responses of individuals’ brains to the components of native advertising (attractiveness and content quality), the results showed that a significant relationship was found only in the average absolute PSD of the beta wave, which was positive and significant. The positive relationship between the impact of effective native advertising on individuals’ attitudes (self-reports) and changes in the spectral power density of brain waves (neural responses) when exposed to effective native advertisements in the F7 theta wave channel and the F3 alpha and beta wave channels (left hemisphere) showed that, in positive emotions, the brain’s neural responses to advertisements may agree with individuals’ self-reports.
Study limitations
The experiment was conducted offline without being embedded within a specific platform context. Given that participants tend to focus more compared to when they are browsing news websites, it is recommended that future researchers use online native advertising in their experiments. Neuromarketing is an interdisciplinary field requiring marketing, neuroscience, and psychology expertise. Therefore, the lack of access to experts who can understand and integrate these three disciplines increased the research process’s complexity and duration. Hence, researchers are advised to conduct their work within companies or institutions with access to proficient neuromarketing specialists in all three areas.
Ethical Considerations
Compliance with ethical guidelines
This study was approved by the Research Ethics Committee of Islamic Azad University, Rasht Branch (Code: IR.IAU.RASHT.REC.1401.027). All participants were informed about the study objectives and the voluntary nature of participation.
Funding
This research was extracted from the doctoral dissertation of Mina Montakhab Madani, approved by Islamic Azad University, Rasht Branch (Code: 1174825945237041400162407006).
Authors contributions
All authors contributed equally to the conception and design of the study, data collection and analysis, interpretation of the results and drafting of the manuscript. Each author approved the final version of the manuscript for submission.
Conflict of interest
The authors declared no conflict of interest.
Acknowledgements
The authors thank Afshin Dalili, Fariba Biyouki, Leila Kouchakinejad-Eramsadati, Nooshaz Amirahmadi Chomachar and Sara SharifNia for their tremendous experiment assistance.
References
- Hunt K. Native advertising and disclosure [master thesis]. Fayetteville: University of Arkansas; 2017. [Link]
- Martins A, Gavina A, da Silva BM. Native Advertising. Rotura Revista Comunicação, Cult Artes. 2023; 48-63. [DOI:10.34623/acmp-2e37]
- Bamakan SM, Toghroljerdib A, Tirandazib P. Internet of everything driven neuromarketing: Key technologies and challenges. arXiv preprint arXiv [Unpublished]. [Link]
- Burgos-Campero AA, Vargas-Hernandez JG. Analitical approach to neuromarketing as a business strategy. Procedia Soc Behav Sci 2013; 99:517-25. [DOI:10.1016/j.sbspro.2013.10.521]
- Baños-González M, Baraybar-Fernández A, Rajas-Fernández M. The application of neuromarketing techniques in the spanish advertising industry: Weaknesses and opportunities for development. Front Psychol. 2020; 11:2175. [DOI:10.3389/fpsyg.2020.02175] [PMID] [PMCID]
- Gountas J, Gountas S, Ciorciari J, Sharma P. Looking beyond traditional measures of advertising impact: Using neuroscientific methods to evaluate social marketing messages. J Bus Res. 2019; 105:121-35. [DOI:10.1016/j.jbusres.2019.07.011]
- Hsu L, Chen YJ. Neuromarketing, subliminal advertising, and hotel selection: An EEG study. Australas Mark J. 2020; 28(4):200-8. [DOI:10.1016/j.ausmj.2020.04.009]
- Lim WM. Demystifying neuromarketing. J Bus Res. 2018; 91:205-20. [DOI:10.1016/j.jbusres.2018.05.036]
- Ahmed RR, Streimikiene D, Channar ZA, Soomro HA, Streimikis J, Kyriakopoulos GL. The neuromarketing concept in artificial neural networks: A case of forecasting and simulation from the advertising industry. Sustainability. 2022; 14(14):8546. [DOI:10.3390/su14148546]
- Kaheh S, Ramirez M, Wong J, George K. Neuromarketing using EEG Signals and Eye-tracking. Paper presented at: 2021 IEEE International Conference on Electronics, Computing and Communication Technologies (CONECCT). 2021 July 9; Bangalore, India. [DOI:10.1109/CONECCT52877.2021.9622539]
- Najafabadi AJ, Skryzhadlovska A, Valilai OF. Agile product development by prediction of consumers’ behaviour; using neurobehavioral and social media sentiment analysis approaches. Procedia Comput Sci. 2024; 232:1683-93. [DOI:10.1016/j.procs.2024.01.166]
- Rejer I, Jankowski J. Brain activity patterns induced by interrupting the cognitive processes with online advertising. Cogn Process. 2017; 18(4):419-30. [DOI:10.1007/s10339-017-0815-8] [PMID] [PMCID]
- Mohammadpour M, Mozaffari S. Classification of EEG-based attention for brain computer interface. Paper presented at: 2017 3rd Iranian conference on intelligent systems and signal processing (ICSPIS). 2017 Dec 20; Shahrood, Iran. [DOI:10.1109/ICSPIS.2017.8311585]
- Salari D. [A comparative Analysis of advertising effectiveness of Bank Melli Iran’s after the new media (social networks) (Persian)] [MA thesis]. Tehran: ArtSooreh University. Culture and Communication Faculty; 2017.
- Bercea MD. Quantitative versus qualitative in neuromarketing research. MPRA. 2013; 1-19. [Link]
- Ho Nguyen H, Nguyen-Viet B, Hoang Nguyen YT, Hoang Le T. Understanding online purchase intention: The mediating role of attitude towards advertising. Cogent Bus Manage. 2022; 9(1):2095950. [DOI:10.1080/23311975.2022.2095950]
- Hamelin N, El Moujahid O, Thaichon P. Emotion and advertising effectiveness: A novel facial expression analysis approach. J Retailing Consum Serv. 2017; 36:103-11. [DOI:10.1016/j.jretconser.2017.01.001]
- Gurgu E, Gurgu IA, Tonis RB. Neuromarketing for a better understanding of consumer needs and emotions. Independent J Manage Prod. 2020; 11(1):208-35. [Link]
- Mashrur FR, Rahman KM, Miya MTI, Vaidyanathan R, Anwar SF, Sarker F, et al. An intelligent neuromarketing system for predicting consumers' future choice from electroencephalography signals. Physiol Behav. 2022; 253:113847. [DOI:10.1016/j.physbeh.2022.113847] [PMID]
- Golnar-Nik P, Farashi S, Safari MS. The application of EEG power for the prediction and interpretation of consumer decision-making: A neuromarketing study. Physiol Behav. 2019; 207:90-98. [DOI:10.1016/j.physbeh.2019.04.025] [PMID]
- Van Diepen RM, Foxe JJ, Mazaheri A. The functional role of alpha-band activity in attentional processing: The current zeitgeist and future outlook. Curr Opin Psychol. 2019; 29:229-238. [DOI:10.1016/j.copsyc.2019.03.015] [PMID]
- Khushaba RN, Wise C, Kodagoda S, Louviere J, Kahn BE, Townsend C. Consumer neuroscience: Assessing the brain response to marketing stimuli using electroencephalogram (EEG) and eye tracking. Expert Syst Appl. 2013; 40(9):3803-12. [DOI:10.1016/j.eswa.2012.12.095]
- Darabi M, Azizian N, Moharramzadeh M, Nobakht F. Processing and analysis of electroencephalography signal to evaluate the effect of sport advertisement on customers. J Adv Sport Technol. 2018; 2(2):15-27. [Link]
- Ghasemi Siani M, Mohammadi S, Soltan Hosseini M. [The role of sports-related advertising in the park in brainwave changes of people using QEEG (Persian)]. Sport Manage J. 2022; 13(4):1197-213. [DOI:10.22059/jsm.2020.299301.2430]
- Izadkhah MM, Yahyaie S. [Analysis of conscious and unconscious animation audience behavior in children using neuromarketing (Persian)]. New Media Stud. 2016; 2(5):102-35. [DOI:10.22054/cs.2017.7006]
- Alsakaa AA, Borawska A, Borawski M, Łatuszyńska M, Piwowarski M, Babiloni F, Nermend K. Cognitive neuroscience techniques in determining the right time of advertising. Paper presented at: IOP Conference Series: Materials Science and Engineering. 2020 May 18; Bristol, England. [DOI:10.1088/1757-899X/671/1/012033]
- Eijlers E. Emotional experience and advertising effectiveness: On the use of EEG in marketing [doctoral dissertation]. Rotterdam: Erasmus University Rotterdam; 2020. [Link]
- Stasi A, Songa G, Mauri M, Ciceri A, Diotallevi F, Nardone G, et al. Neuromarketing empirical approaches and food choice: A systematic review. Food Res Int. 2018; 108:650-64. [DOI:10.1016/j.foodres.2017.11.049] [PMID]
- Farzi H, Yousefi B, Sadeghi Borujerdi S. [The effect of identification on attitude toward advertisements of celebrity athlete using neuromarketing technique (Persian)]. Sport Physiol Manage Invest. 2019; 11(4):175-87. [Link]
- Borawska A, Oleksy T, Maison D. Do negative emotions in social advertising really work? Confrontation of classic vs. EEG reaction toward advertising that promotes safe driving. Plos One. 2020; 15(5):e0233036. [DOI:10.1371/journal.pone.0233036] [PMID] [PMCID]
Type of Study: Research |
Subject:
Special
Received: 2024/11/25 | Accepted: 2024/12/25 | Published: 2025/01/1
Received: 2024/11/25 | Accepted: 2024/12/25 | Published: 2025/01/1
Send email to the article author
| Rights and permissions | |
 | This work is licensed under a Creative Commons Attribution-NonCommercial 4.0 International License. |

Copyright © The Author(s);
This is an open access article distributed under the terms of the Creative Commons Attribution License (CC-By-NC), which permits use, distribution, and reproduction in any medium, provided the original work is properly cited and is not used for commercial purposes.
Contact Information