Sun, Feb 1, 2026
Volume 10, Issue 1 (Winter 2024)
Caspian J Neurol Sci 2024, 10(1): 20-30 |
Back to browse issues page


Download citation:
BibTeX | RIS | EndNote | Medlars | ProCite | Reference Manager | RefWorks
Send citation to:


BibTeX | RIS | EndNote | Medlars | ProCite | Reference Manager | RefWorks
Send citation to:
Dadjoo M, Rezaei S, Rohampour K, Naseh A, Sadeghi Bajestani G. Artificial Neural Network in Autism Spectrum Disorder Diagnosis Based on Quantitative Electroencephalography. Caspian J Neurol Sci 2024; 10 (1) :20-30
URL: http://cjns.gums.ac.ir/article-1-661-en.html
URL: http://cjns.gums.ac.ir/article-1-661-en.html


1- Exceptional Child Psychology and Education, University of Guilan, Rasht, Iran.
2- Department of Psychology, Faculty of Literature and Humanities, University of Guilan, Rasht, Iran. ,rezaei_psy@hotmail.com
3- Department of Physiology, School of Medicine, Guilan University of Medical Sciences, Guilan, Rasht, Iran.
4- Department of Psychology, University of Guilan, Rasht, Iran
5- Biomedical Engineering, Imam Reza International University, Mashhad, Razavi Khorasan, Iran.
2- Department of Psychology, Faculty of Literature and Humanities, University of Guilan, Rasht, Iran. ,
3- Department of Physiology, School of Medicine, Guilan University of Medical Sciences, Guilan, Rasht, Iran.
4- Department of Psychology, University of Guilan, Rasht, Iran
5- Biomedical Engineering, Imam Reza International University, Mashhad, Razavi Khorasan, Iran.
Full-Text [PDF 2231 kb]
(629 Downloads)
| Abstract (HTML) (1552 Views)
Full-Text: (572 Views)
Introduction
Since 2013, autism spectrum disorder (ASD) has been classified as a neurodevelopmental disorder in the diagnostic and statistical manual of mental disorders, 5th Edition [1]. Even though ASD is associated with nervous system dysfunction, it is solely diagnosed based on clinical interviews and observation. For many years, specialists have benefited from electroencephalography (EEG) to study the brain structure of individuals. EEG is a noninvasive measure used to examine the macroscopic neuronal circuit’s functionality and maturation, prompting an assessment of brain activities such as rhythms and dynamics [2]. Displaying brain waves in every lobe, EEG provides valuable information to gain proper knowledge of brain function, adequately recognize disorders, diagnose deficiencies, and develop therapeutic protocols. In recent years, EEG and artificial neural networks (ANN) have been among the most employed frameworks in artificial intelligence and have assisted specialists in reaching more accurate diagnoses. Various disorders, especially neurodevelopmental ones, can be investigated, identified, and diagnosed by EEG and ANN. The complementary properties of these two approaches assist us in recognizing and diagnosing ASD thoroughly and promptly.
Today, computer-aided diagnosis is extensively employed by specialists and physicians. Typically, these systems cannot be applied alone, but their assistance makes specialists reach diagnoses more accurately and faster [3]. EEG and Machine learning (ML) are the most applied tools for diagnosing and categorizing neurodevelopmental disorders [4, 5, 6].
EEG is a widespread, low-cost, and noninvasive method used for diagnosing mental disorders [2, 7, 8]. Numerous studies have recently revealed that the brain signals of individuals with ASD are significantly different from those without this disorder [9, 10]. It has been reported that the brain signals of individuals with ASD are 81% different from their normal peers; these differences can be used for classification and diagnosis [11]. Differences related to brain signals have been observed in the prefrontal (Fp1 & Fp2), left temporal (T7), and occipital regions (O1 & O2) [12]. Generally, the sources of generating brain signals in people without autism interact in groups in different areas. However, in people with autism, this coherence of resources in generating brain signals is less. Also, these differences are primarily observed in the left hemisphere of people with ASD [13].
ANNs are modeled after the brain network. These networks employ nonlinear and complex inputs to solve problems and reach output responses [14]. Today, ANNs are applied for medical purposes due to their diverse uses and capacities to categorize voluminous data quickly [15]. ANN can assist with differentiating the signals of individuals with and without ASD [12, 16]. The accuracy and validity of these networks in ASD diagnosis have been well confirmed despite some limitations (age, gender, and so on) [17, 18, 19].
Recent studies indicate that with the help of EEG and ANN, it is possible to predict ASD with high accuracy even at three months old [5]. High precision and speed, ease of use, and non-invasiveness are among the features of these methods. In addition, the originality of these tools has provided researchers with many research fields [3, 20, 21]. In many types of research areas, the use of these tools in determining the difference between the brain signals of people with autism and those without autism in the early ages of birth has been confirmed [3, 5, 21]. Still, there is no accurate and targeted study in diagnosing this disorder using the combination of ANN and EEG. In the latest studies, the presence of biomarkers in the brain signal of people with ASD has been confirmed [5]. However, a distinctive marker that helps us in the early diagnosis of this disorder has not yet been verified.
Since the diagnosis of a disorder at an appropriate time provides the utmost chance for treating or controlling a specific condition or disorder, an early diagnosis of ASD will improve the performance and adjustment of individuals with ASD in the future. The growing number of individuals with ASD has drawn the attention of researchers to study and examine it as one of the most prevalent disorders in children and adolescents in recent decades. Thanks to the advancement of diagnostic tools, it is now possible to diagnose ASD in the initial years of life and thus considerably impact the controlling process. Also, with the limited scope of research about using artificial neural networks in diagnosing ASD based on EEG in Iran, the novelty of this diagnostic approach in neuroscience is essential. The present study aimed to diagnose ASD using ANN and brain signals recorded by an EEG.
Materials and Methods
Study participants
In this study, the brain signals of 45 children were recorded: 34 children with ASD and 11 children without neurodevelopmental disorders aged 3-7 years old. They were all referring to the neurodevelopmental centers in Mashhad City, Iran. The disorder was clinically diagnosed according to the DSM-5 by child psychology specialists and child neurologists. Considering the age symptoms onset of ASD (2.5-3 years) and the lack of diagnosis of ASD until the age of preschool (6-7 years) in Iran, the age range of 3 to 7 years has been determined as the entry criteria for participants in this study. This study used subjects who met all these conditions. In the autism group, the children had ASD diagnoses based on DSM-5 criteria and experts’ approval, aged 3-7 years, with parents’ consent to participate in the research. In the control group, children had no neurodevelopmental disorder (NDD), aged 3-7 years, with the permission of the children’s parents to participate in this research. The exclusion criterion for the ASD group was the diagnosis of comorbid disorder with autism. For the control group, the exclusion criterion was a lack of parental consent regarding the child’s participation in this research.
Electroencephalogram (EEG)
EEG records the electrical activity of brain neurons. EEG is typically utilized to assess the performance of different brain parts. The C3 and C4 electrodes, positioned in the brain’s central region, were employed for this study. These electrodes were chosen because numerous studies have reported that children with ASD have issues in their amygdala. Dysfunction of the amygdala causes turmoil in the child’s visual and auditory system, culminating in the failure to interact socially through eye contact, analyze facial expressions, grasp the person’s condition psychologically, and develop empathy in relationships [22]. Positioning electrodes in the central region is close to the amygdala. Also, placing electrodes in the central region reduces their noise and prevents them from falling unexpectedly. Some children with ASD have tribulation to deal with sensory processing information. Repetitive movements, resistance to touch, and hyperacusis are the most common symptoms. Such behaviors are additionally named sensory integration disorder. As a result, we utilized electrodes in the central regions rather than a cap [23-25]. This study recorded brain signals operating two electrodes with a sampling frequency of 256 Hz positioned in the central region based on the standard 10-20 system.
Artificial neural network (ANN)
ANN is a network of simple neurons that receive inputs and deliver outputs based on their predefined activation functions. ANN is formed by connecting the output of some neurons directly to the input of some other neurons. The weights and functions that compute activation are modified through learning and handled by a learning algorithm [26]. The radial basis function network (RBFN) was employed in this study. RBFN can discriminate and categorize the two groups under concern in the case of the lack of data and when the data of the two groups do not match. RBFN is a type of feed-forward neural network. In RBFN, activator functions are Gaussian [27]. In this study, all coding was done in MATLAB.
Study procedures
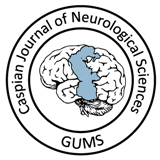
Signals were recorded in a small acoustic room with a voice and image control capacity without environmental noises. The children were sitting on a chair facing a monitor. After placing the electrodes on their heads, the brain signals were recorded for 1 minute (the baseline stage). One day before their reference, the children’s parents were asked about their children’s favorite animations. After the baseline stage, signals were recorded for 5 minutes while the children watched the animations (the with-voice stage). Then, the animation voice was muted when the children’s attention was engrossed in the animations. The children’s brain signals were recorded for 5 minutes while watching voiceless animations (the without-voice stage). The sampling frequency equaled 256 Hz in the three recording conditions. It is worth mentioning that the parents of all children had completed the informed consent forms.
The second step aimed to diagnose ASD based on the EEG indices and compare the brain signals of children with and without ASD, and constituted the main study of this research. In this study, all data were investigated by the EEGLAB plugin in MATLAB software after being sorted. Moreover, as much as possible, the software removed apparent noises and muscle artifacts from this experiment. Then, the brain signals were reanalyzed and reinvestigated. With the help of programming codes, the absolute power of the frequency bands (delta [<4 Hz], theta [4-7 Hz], alpha [8-12.5 Hz], mu rhythm [7-10 Hz], beta [13-30 Hz], and gamma [30-48 Hz (low) & 60-100 Hz (high)]) was extracted from the brain signals of the samples. This stage aimed to compare the brain signals of children with ASD and children without any NDD regarding the absolute power of the frequency bands and run a pairwise comparison between the absolute powers of the frequency bands in these two groups. These comparisons were attained through multivariate analysis of covariance (MANCOVA) and discriminant function analysis (DFA).
Next, the absolute power of the frequency bands was applied as the input of the ANN, which produced appropriate output accordingly. In this stage, a radial basis function network was employed as the neural network for classification. This network was used due to the small number of children without any NDD and the disproportionateness of samples between the two groups (11 children in the control group vs 34 children in the ASD group). In the training phase of the ANN, all 45 samples were used to train the ANN with the radial basis function (RBF) algorithm. The network test phase was also run on the same 45 samples. The designed neural network algorithm possessed seven inputs (the absolute power of the frequency bands), and there was an output per input. The neural network output should diagnose if the child has ASD based on the absolute power of the frequency bands. All algorithms were implemented in MATLAB (Figure 1).
Results
The statistical sample includes 34 children with ASD and 11 children without NDD as a control group. In terms of gender distribution, there were 13 girls (5 girls with ASD and 8 girls without NDD) and 32 boys (29 children with ASD and 3 children without NDD). Data analysis was conducted using descriptive statistics such as percentage, frequency, and Mean±SD. The Shapiro-Wilk test was used to assess the data normality, and Levene’s test for homogeneity of variance. The absence of auto-correlation and multicollinearity was evaluated and confirmed. We run the analyses using IBM SPSS software, version 24, at a significance level of P<0.05. In this section, the findings of the MANCOVA are first reported for each channel and at each stage of brain signal recording. Then, graphs are drawn to report each channel’s findings by the frequency bands’ absolute power. To eliminate the effect of the gender variable, it was considered a covariate in MANCOVA.
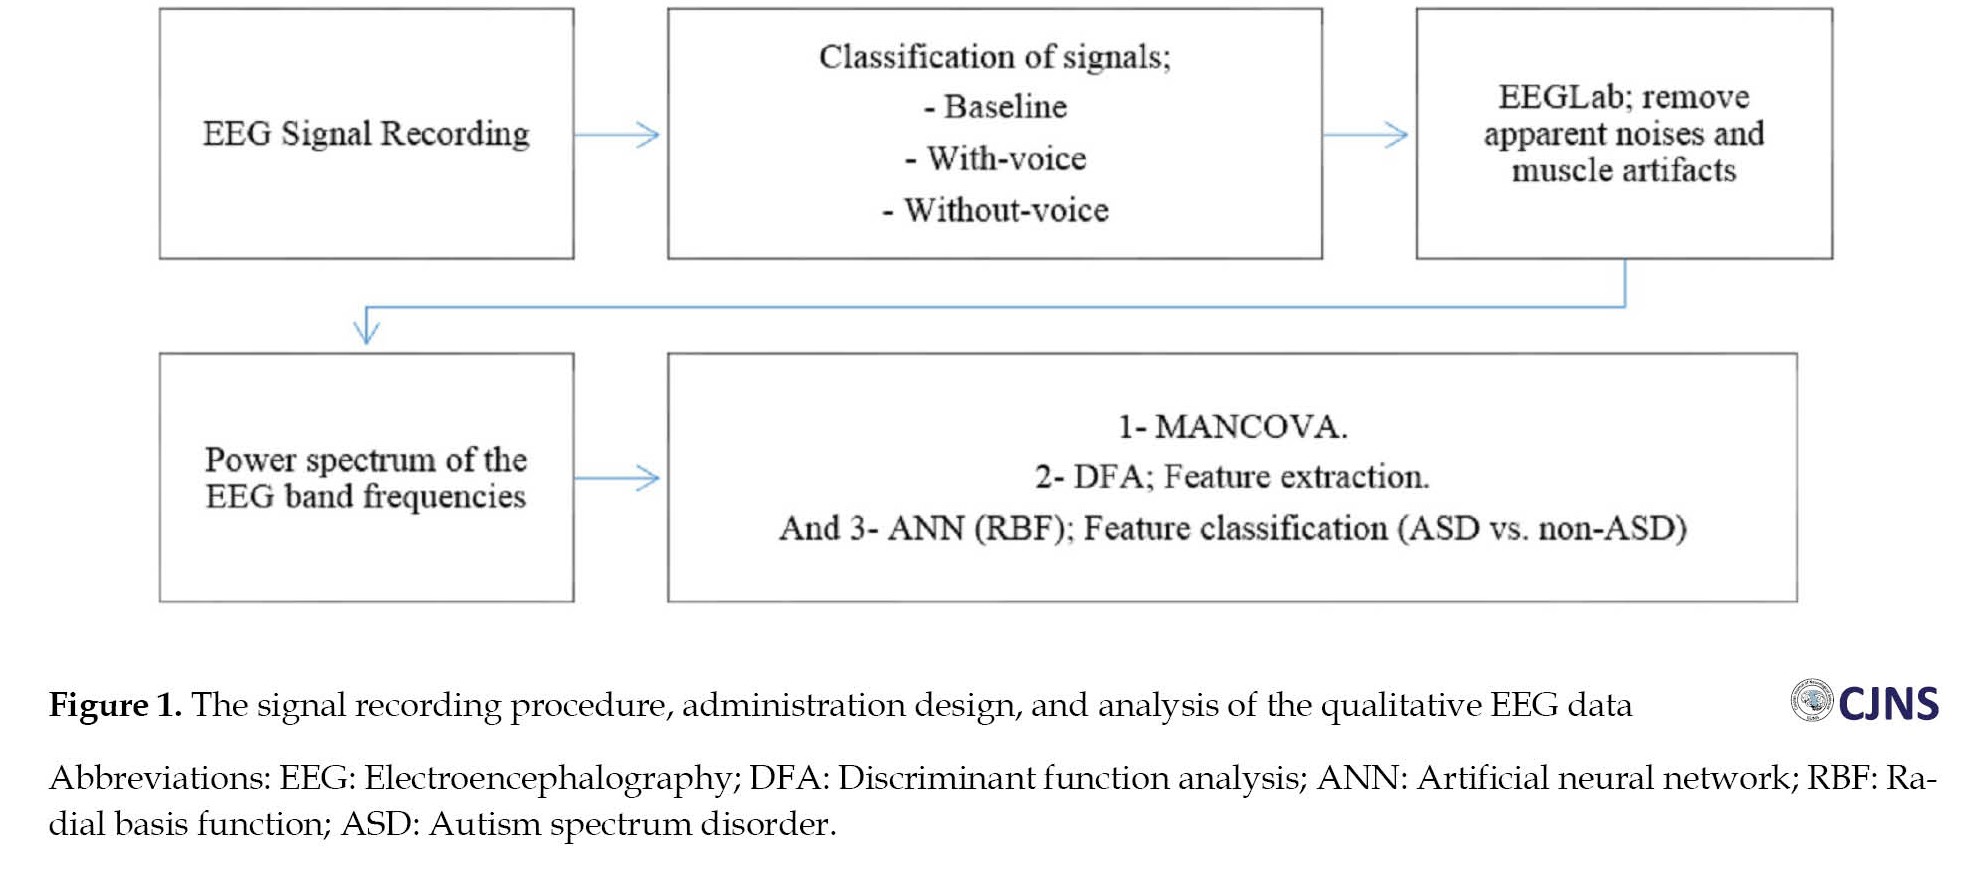
The results of the MANCOVA test concerning the two brain signal recording stages revealed a significant difference between the children with ASD and those without any NDD in their mu rhythm frequency bands of the left (C3) and right (C4) hemispheres (P<0.05) (Table 1).
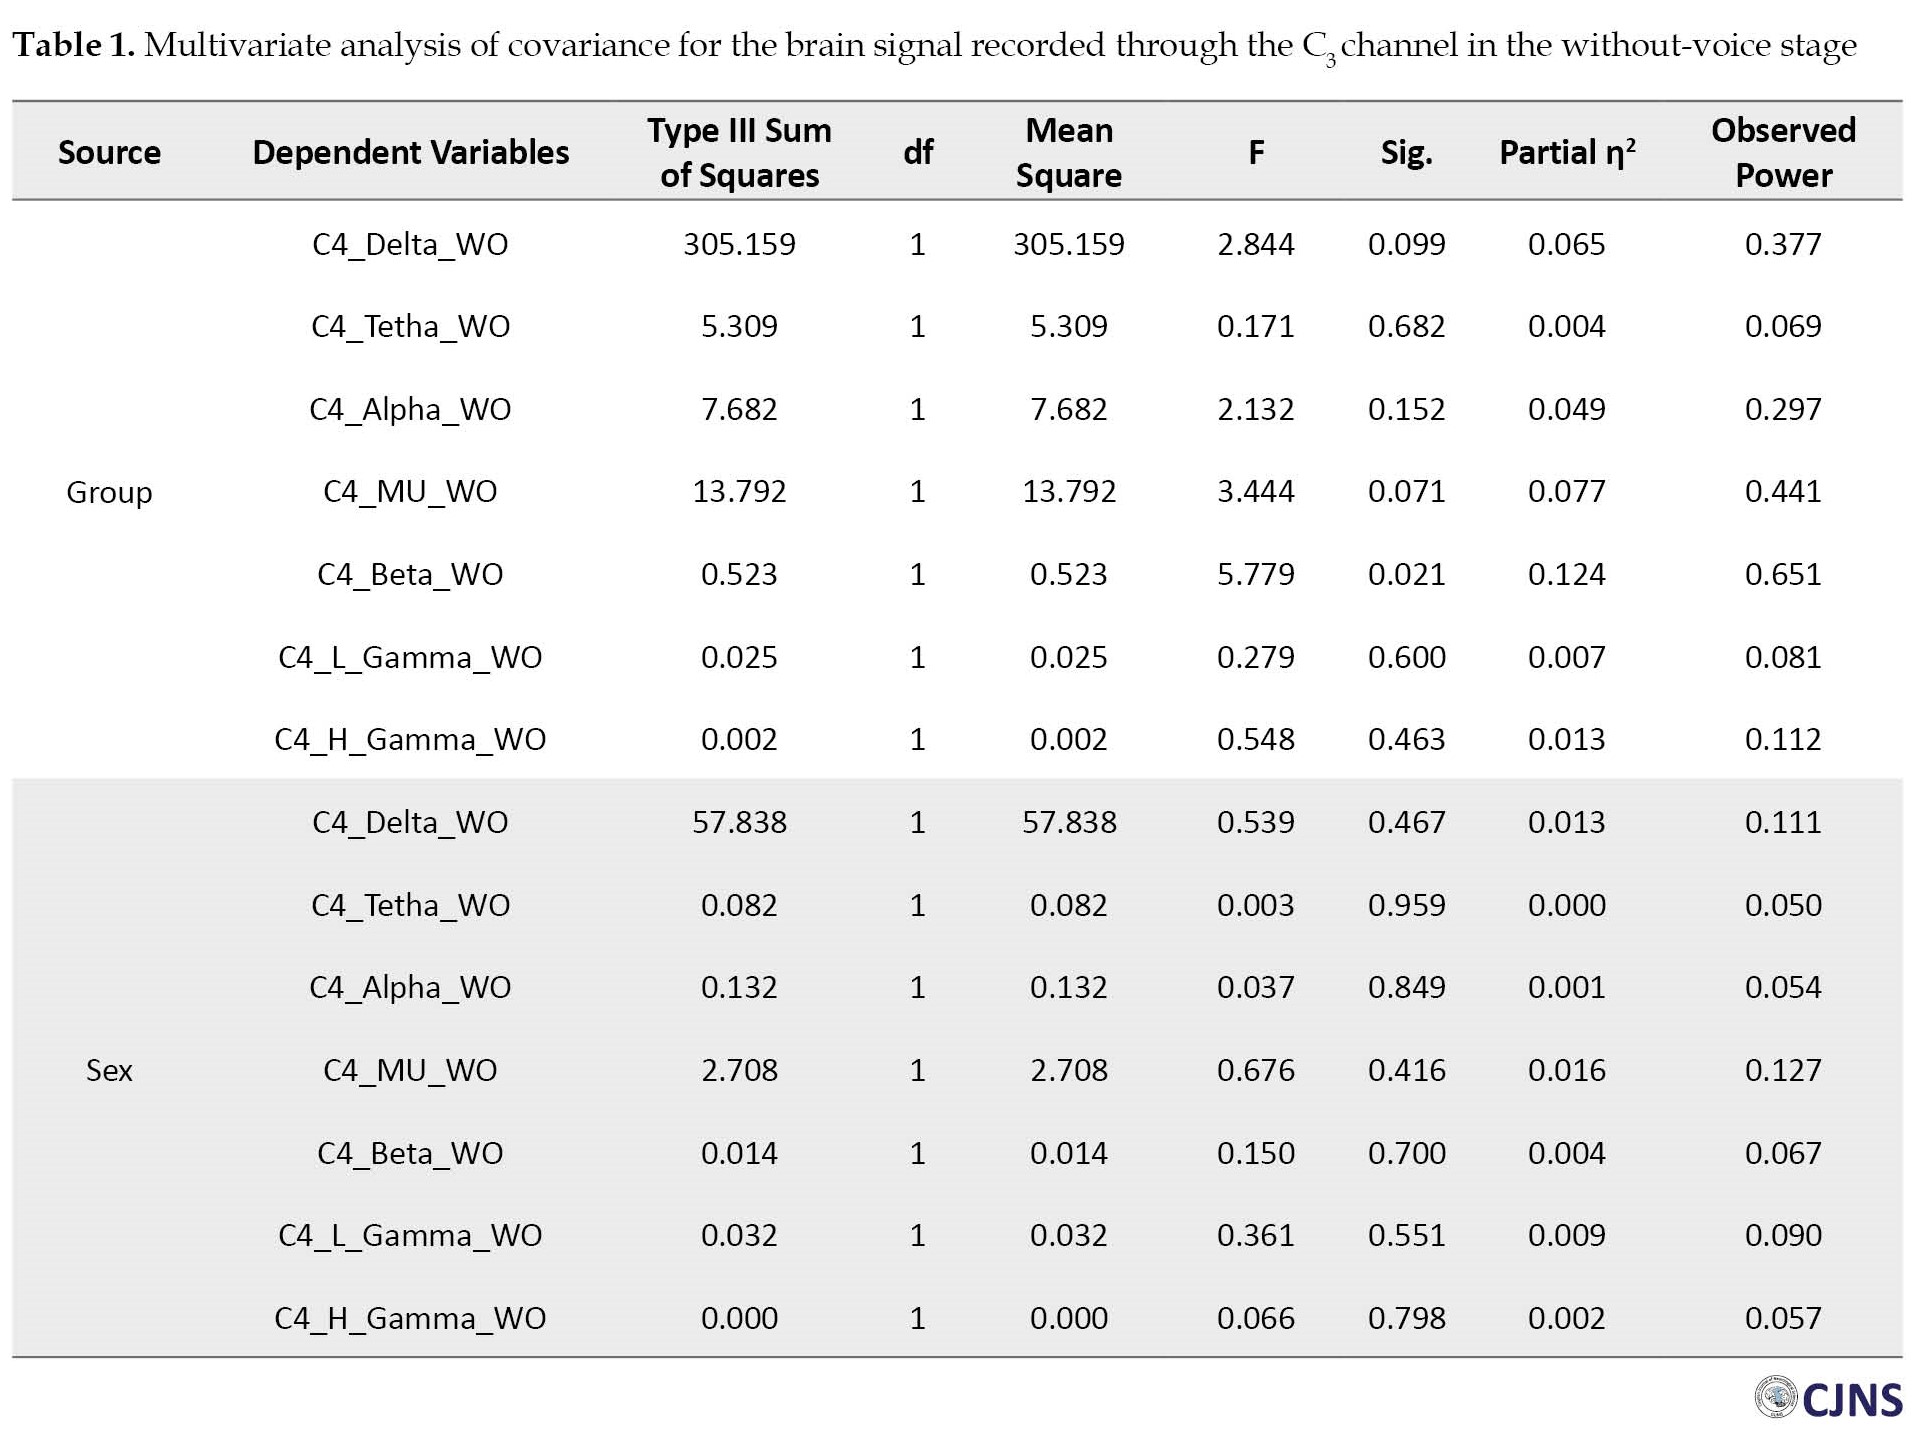
The MANCOVA results vividly showed a significant difference between the mean absolute power of the mu rhythm frequency bands of the children with ASD (Mean±SD 4.494±2.680 Hz) and children without NDD (Mean±SD 6.754±2.226 Hz) in the without-voice EEG stage of the left hemisphere (Table 1). There was also a difference in the mean absolute power of the mu rhythm frequency bands of the children with ASD (Mean±SD 4.464±2.290 Hz) and their normal peers (Mean±SD 6.515±3.412 Hz) in the without-voice EEG stage of the right hemisphere (Table 2).
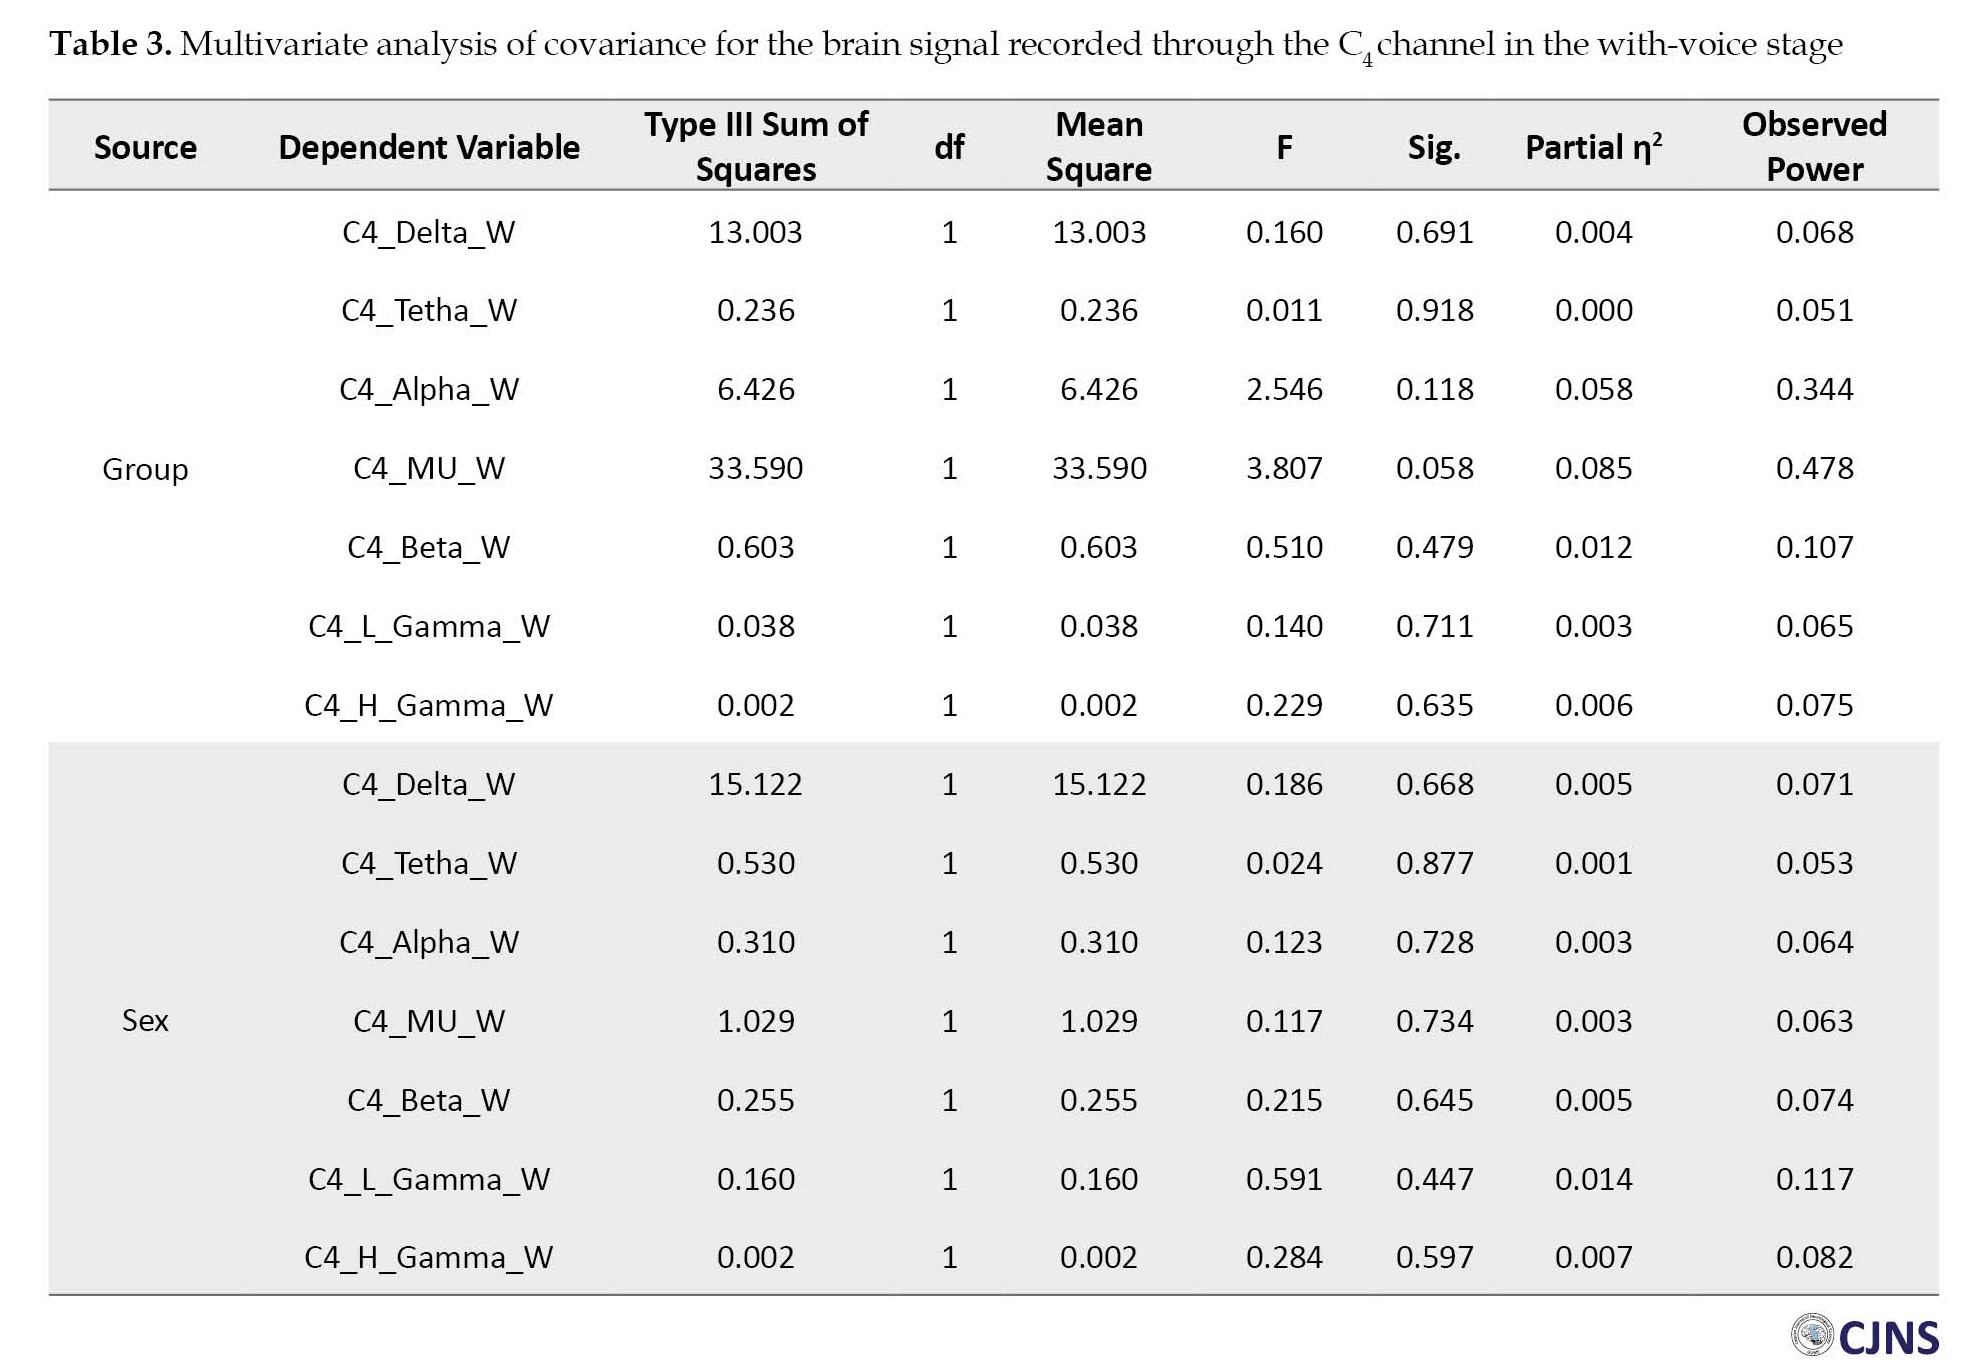
However, the children with ASD (Mean±SD 4.499±2.280 Hz) and those without ASD (Mean±SD 6.759±2.226 Hz) were only different in the with-voice EEG stage of their right hemispheres (Table 3).
The MANCOVA results showed no statistical significance in other band frequencies (delta, theta, alpha, beta, gamma; P>0.05).
Table 4 presents the results of DFA classification in different stages (baseline, with and without voice).
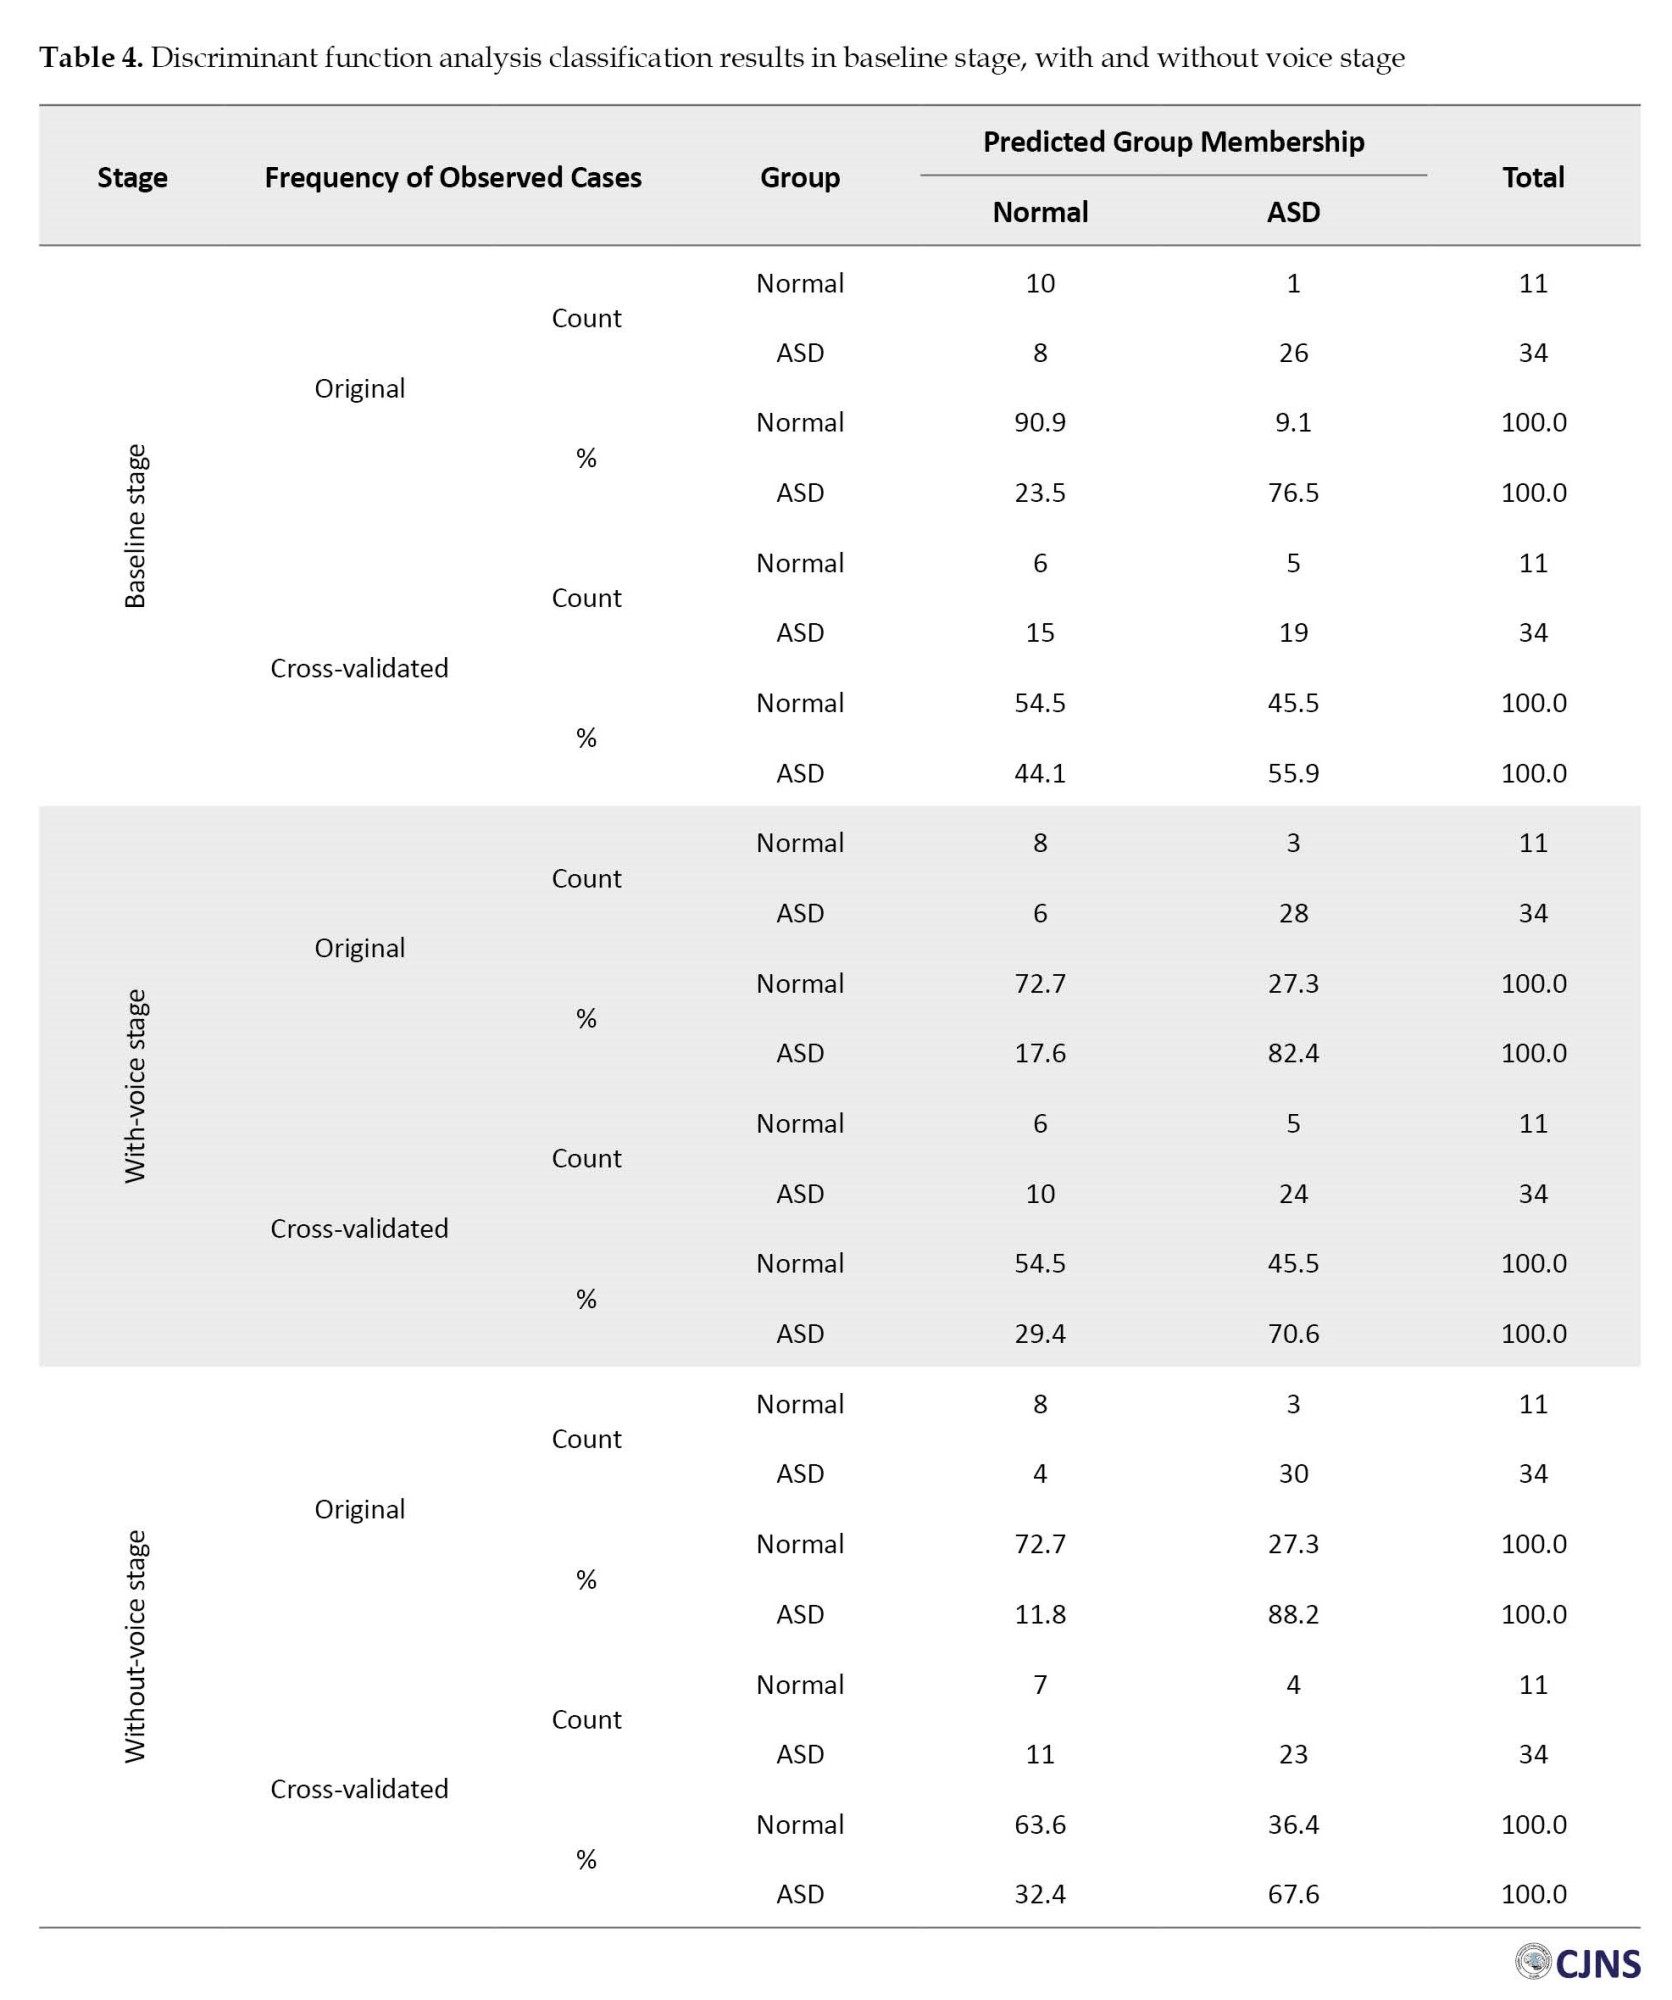
In the baseline EEG stage, DFA results, based on the frequency bands extracted from the brain signals of these children, revealed sensitivities of 44.1% for children without NDD, 55.9% for children with ASD, and 55.6% for separating both groups of children. In the with-voice signal recording stage, the results show sensitivities of 54.4% for children without NDD, 70.6% for children with ASD, and 66.7% for separating the children in both groups. During the without-voice EEG stage, the findings display sensitivities of 63.6% for children without NDD, 70.6% for children with ASD, and 67.6% for separating both groups of children from each other.
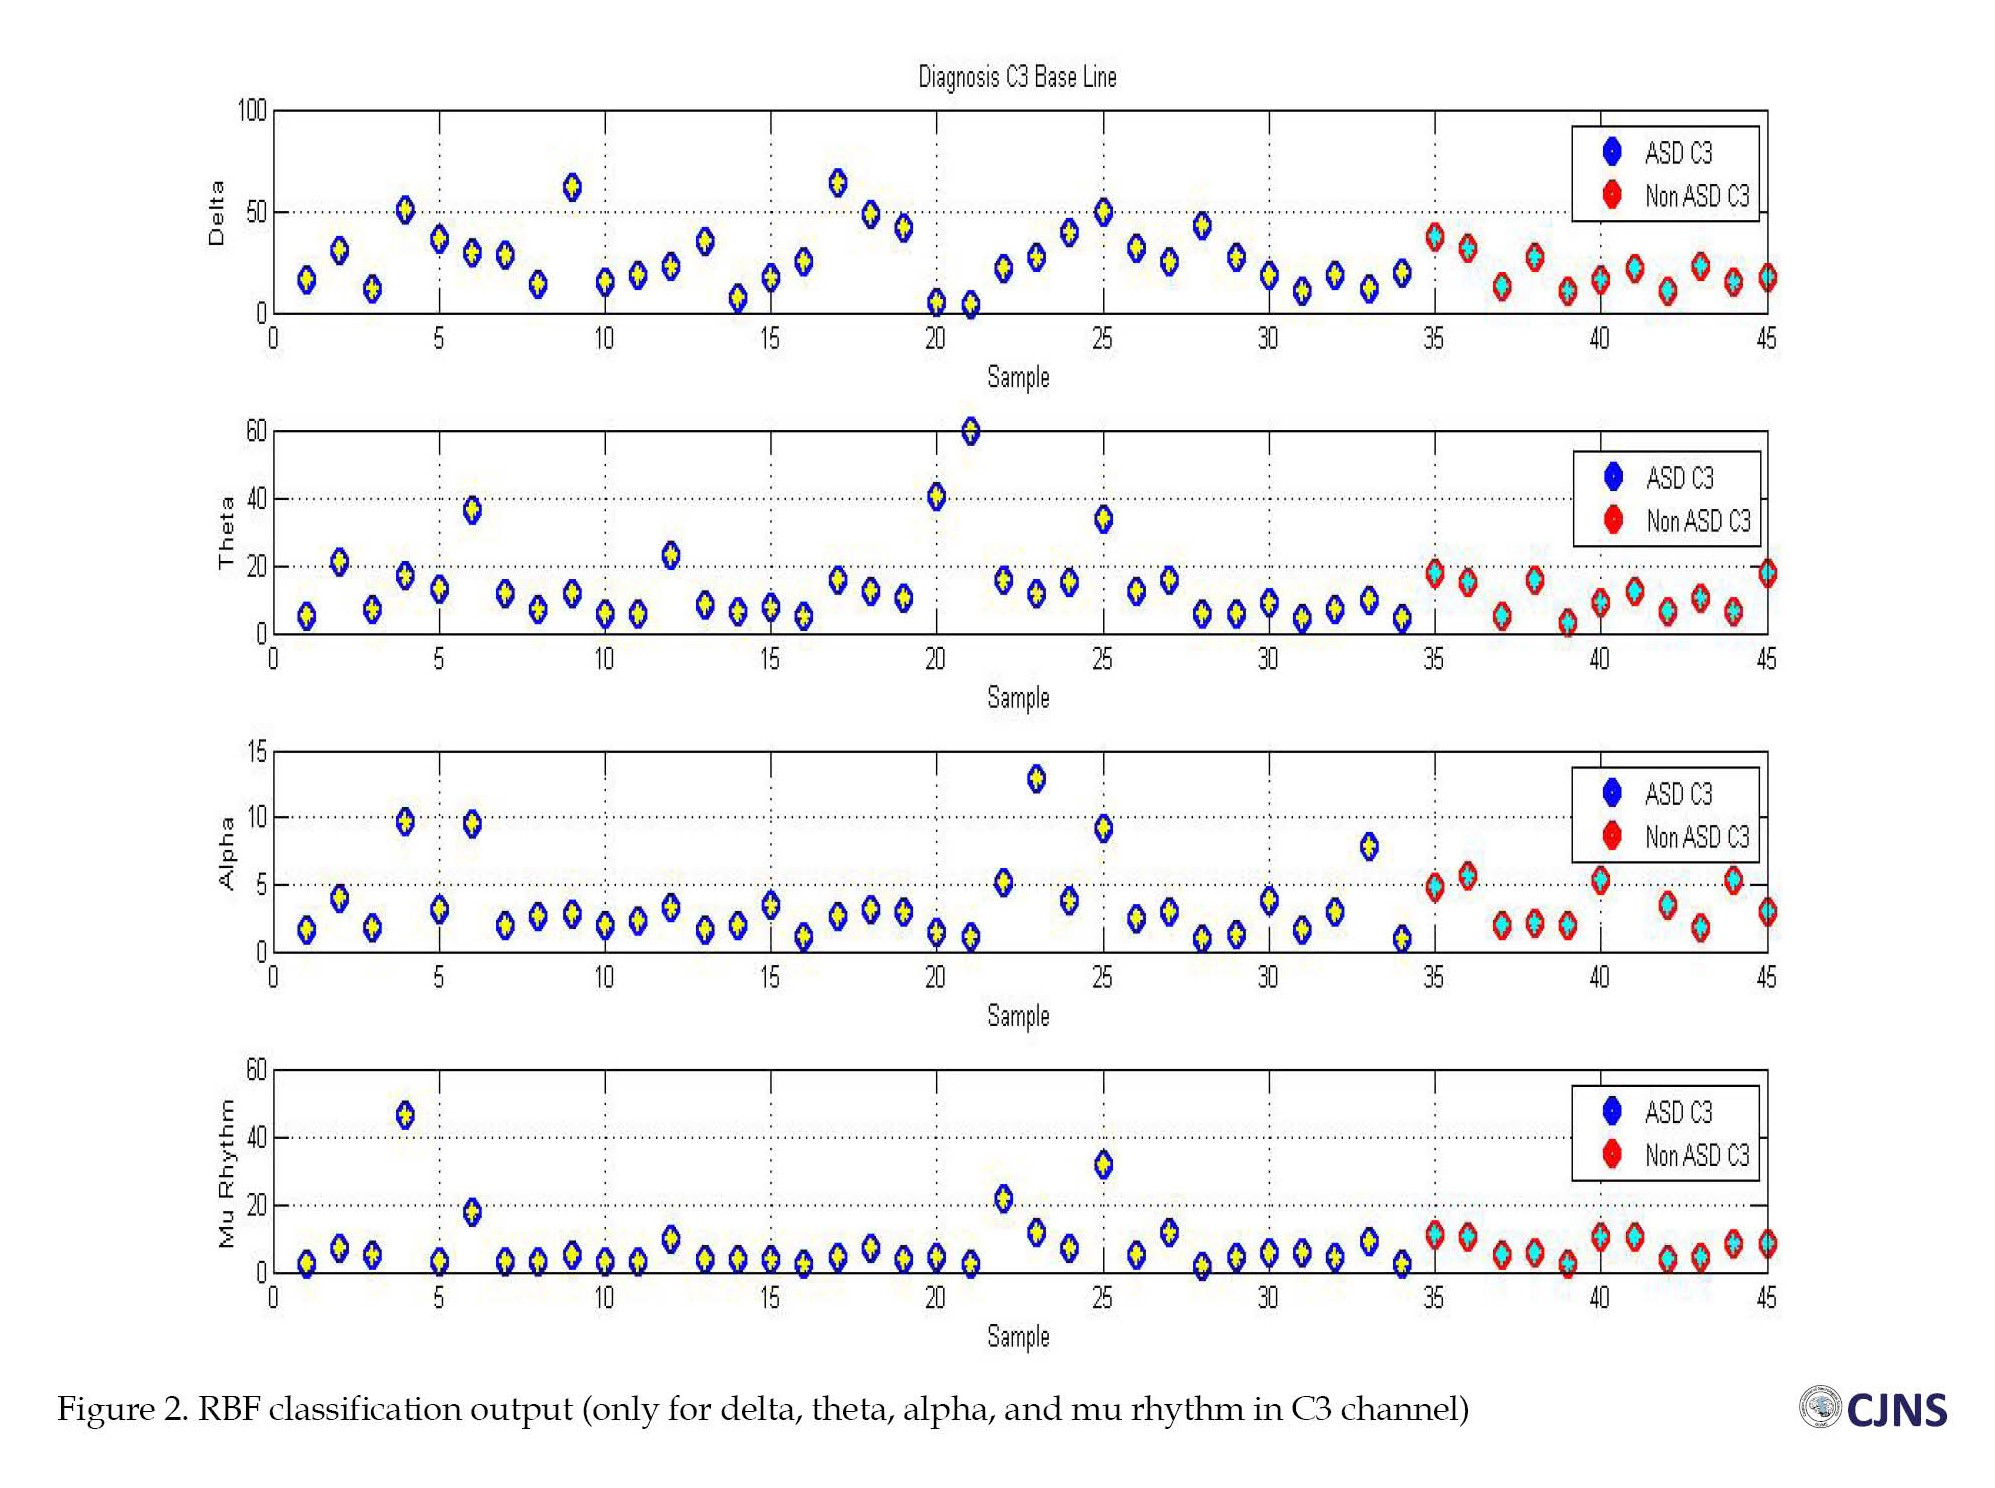
In the diagnosis stage, the designed neural network algorithm possesses seven inputs (the absolute powers of the frequency bands), and an output exists per input. If the post-training output of the neural network was <0.5 during the testing of the samples, the considered child is classified into the children without NDD group. Otherwise, the subject was classified into the ASD group (Figure 2).
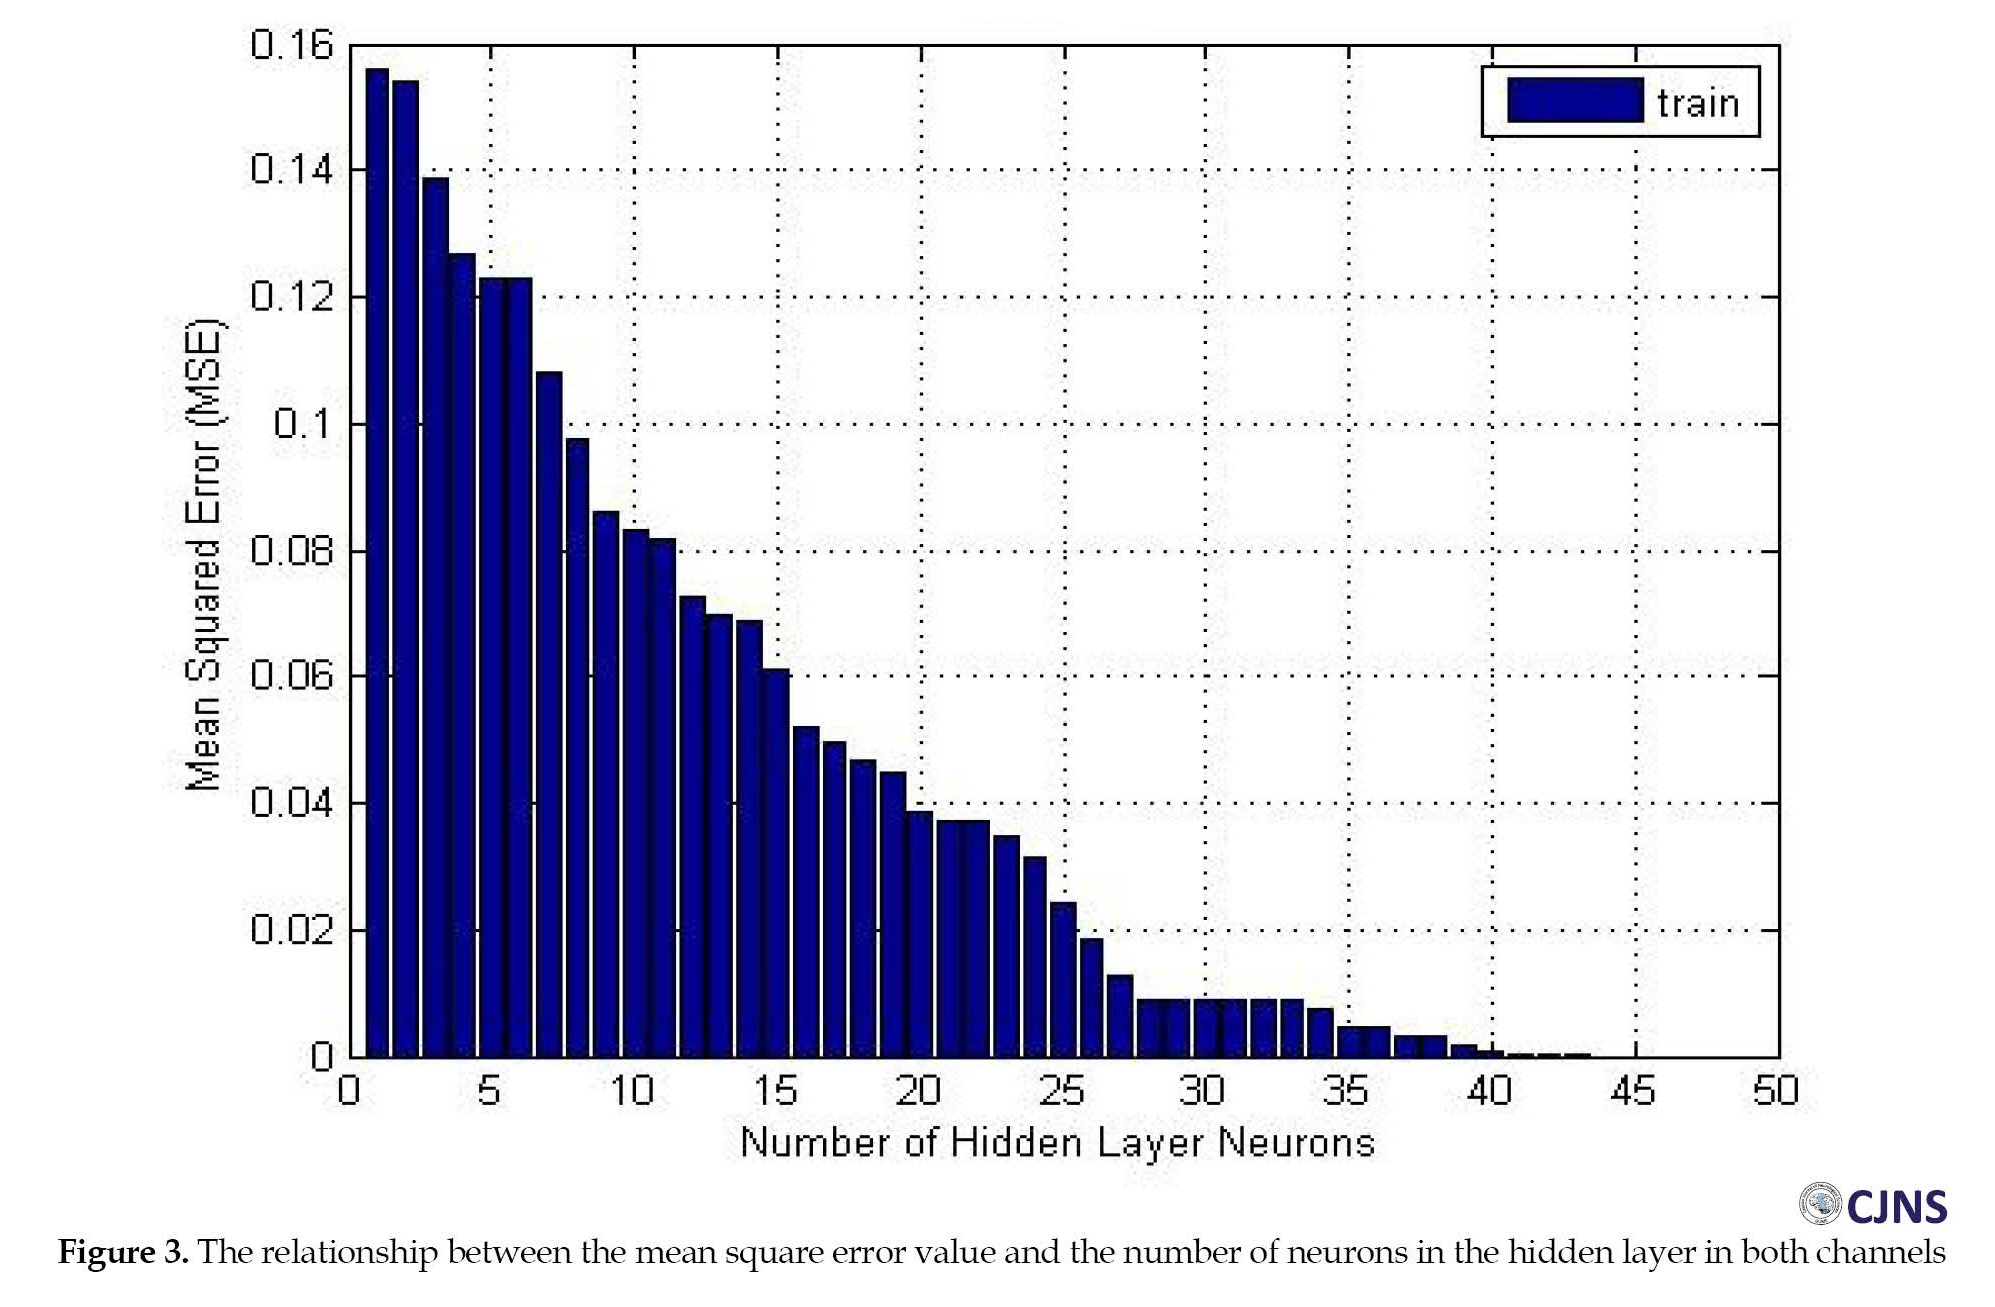
 The algorithm of the radial basis function network, designed and trained for 45 samples (34 brain signals of children with ASD and 11 brain signals of children without NDD), with 40±2 neurons in the hidden layer and a mean square error (MSE) of 1.22325e-5 can classify and differentiate the brain signals of children with ASD from children without NDD (Figure 3).
 Blue circles are ASD samples, red circles are non-ASD samples, and stars show the RBF output. The designed RBF accurately recognized the targets as the yellow stars, the ASD signal, which precisely fit into blue circles, and green stars, which are the non-ASD signal, which fit into red circles.
Discussion
The present study aimed to diagnose ASD using brain signals and ANN. The MANCOVA and DFA results revealed that the mean absolute power of the brain signal frequency bands was useful in determining the brain signal differences of these children and diagnosing ASD. The pairwise comparison of the differences between the frequency bands of the two groups revealed the significance of the frequency bands in diagnosis. On the other hand, since qualitative EEG is the most applied and noninvasive tool for diagnosis, the difference in the absolute power of these children’s brain signals can be an index for early diagnosis [1]
The concept of mirror neurons and their impact on imitating common actions justify the deficiency in social relations in children with ASD. So, the effects of the mu rhythm frequency band on this phenomenon have also been reported in Oberman’s [28] and Bernier’s [29] studies. Oberman conducted a study on 66 individuals with ASD and 51 normal persons without neurodevelopmental disorders in the age range of 6-17 years. They showed that the mu rhythm frequency bands were weakened and suppressed in individuals with ASD and significantly different from normal individuals without NDD. Bernier studied 14 children with ASD and 15 children without NDD. Their results revealed that the EEG mu rhythm of the children with ASD was reduced when observing an imitative task. This research also disclosed a considerable difference between children with ASD and their normal peers in their mean absolute powers of the mu rhythm in both channels but only in with- and without-voice stages.
As one of the notable features of ANN, the algorithm designed in this research can distinguish children with ASD from their normal peers despite some limitations concerning the number of samples. The present research results and other corresponding studies yield well-documented reasons for applying computer-assisted tools for children’s early diagnosis and classification of ASD.
Conclusion
The sample limitations and the inequality of the participants in the two groups were the limitations of this research, considerably impacting the outputs of the statistical and DFA analyses. Although there are some reasons for employing the C3 and C4 channels in recording brain signals, they do not seem to be the most optimal channels for recording the brain signals of children with ASD. Furthermore, this research finding and other studies show that signal recording at rest time or, according to the data of this research, at the baseline stage is sufficient for diagnosing ASD based on frequency bands. It is better to record brain signals in a single stage. So, the output is a clean signal with minimum artifacts and noises with precision. It is suggested that future studies attend to the limitations of this research and take steps for their removal to raise generalizability and approval in clinical environments. Therefore, the results can pave the way for the early diagnosis of ASD and the application of computer-assisted tools in clinical environments.
Ethical Considerations
Compliance with ethical guidelines
All study procedures were in compliance with the ethical guidelines of the Declaration of Helsinki 2013.
Informed Consent
All parents provided informed consent of their satisfaction with their children’s participation in this research.
Funding
This research is derived from the master’s thesis of Mitra Dadjoo approved by the University of Guilan (Code: 68467).
Authors contributions
Conceptualization, validation, and methodology: Mitra Dadjoo and Sajjad Rezaei; Software and resources; Sajjad Rezaei, Kambiz Rohampour, and Ghasem Sadeghi Bajestani; Formal analysis; Mitra Dadjoo, Sajjad Rezaei, and Kambiz Rohampour; Supervision, investigation, and data curation; All authors, Writing the original draft preparation; Mitra Dadjoo; Review, and editing; Mitra Dadjoo, Sajjad Rezaei, Kambiz Rohampour, and Ashkan Naseh.
Conflict of interest
The authors declared no conflict of interest.
Acknowledgements
The authors would like to thank all the members of University of Guilan and Imam Reza International University for their assistance in this study.
References
Since 2013, autism spectrum disorder (ASD) has been classified as a neurodevelopmental disorder in the diagnostic and statistical manual of mental disorders, 5th Edition [1]. Even though ASD is associated with nervous system dysfunction, it is solely diagnosed based on clinical interviews and observation. For many years, specialists have benefited from electroencephalography (EEG) to study the brain structure of individuals. EEG is a noninvasive measure used to examine the macroscopic neuronal circuit’s functionality and maturation, prompting an assessment of brain activities such as rhythms and dynamics [2]. Displaying brain waves in every lobe, EEG provides valuable information to gain proper knowledge of brain function, adequately recognize disorders, diagnose deficiencies, and develop therapeutic protocols. In recent years, EEG and artificial neural networks (ANN) have been among the most employed frameworks in artificial intelligence and have assisted specialists in reaching more accurate diagnoses. Various disorders, especially neurodevelopmental ones, can be investigated, identified, and diagnosed by EEG and ANN. The complementary properties of these two approaches assist us in recognizing and diagnosing ASD thoroughly and promptly.
Today, computer-aided diagnosis is extensively employed by specialists and physicians. Typically, these systems cannot be applied alone, but their assistance makes specialists reach diagnoses more accurately and faster [3]. EEG and Machine learning (ML) are the most applied tools for diagnosing and categorizing neurodevelopmental disorders [4, 5, 6].
EEG is a widespread, low-cost, and noninvasive method used for diagnosing mental disorders [2, 7, 8]. Numerous studies have recently revealed that the brain signals of individuals with ASD are significantly different from those without this disorder [9, 10]. It has been reported that the brain signals of individuals with ASD are 81% different from their normal peers; these differences can be used for classification and diagnosis [11]. Differences related to brain signals have been observed in the prefrontal (Fp1 & Fp2), left temporal (T7), and occipital regions (O1 & O2) [12]. Generally, the sources of generating brain signals in people without autism interact in groups in different areas. However, in people with autism, this coherence of resources in generating brain signals is less. Also, these differences are primarily observed in the left hemisphere of people with ASD [13].
ANNs are modeled after the brain network. These networks employ nonlinear and complex inputs to solve problems and reach output responses [14]. Today, ANNs are applied for medical purposes due to their diverse uses and capacities to categorize voluminous data quickly [15]. ANN can assist with differentiating the signals of individuals with and without ASD [12, 16]. The accuracy and validity of these networks in ASD diagnosis have been well confirmed despite some limitations (age, gender, and so on) [17, 18, 19].
Recent studies indicate that with the help of EEG and ANN, it is possible to predict ASD with high accuracy even at three months old [5]. High precision and speed, ease of use, and non-invasiveness are among the features of these methods. In addition, the originality of these tools has provided researchers with many research fields [3, 20, 21]. In many types of research areas, the use of these tools in determining the difference between the brain signals of people with autism and those without autism in the early ages of birth has been confirmed [3, 5, 21]. Still, there is no accurate and targeted study in diagnosing this disorder using the combination of ANN and EEG. In the latest studies, the presence of biomarkers in the brain signal of people with ASD has been confirmed [5]. However, a distinctive marker that helps us in the early diagnosis of this disorder has not yet been verified.
Since the diagnosis of a disorder at an appropriate time provides the utmost chance for treating or controlling a specific condition or disorder, an early diagnosis of ASD will improve the performance and adjustment of individuals with ASD in the future. The growing number of individuals with ASD has drawn the attention of researchers to study and examine it as one of the most prevalent disorders in children and adolescents in recent decades. Thanks to the advancement of diagnostic tools, it is now possible to diagnose ASD in the initial years of life and thus considerably impact the controlling process. Also, with the limited scope of research about using artificial neural networks in diagnosing ASD based on EEG in Iran, the novelty of this diagnostic approach in neuroscience is essential. The present study aimed to diagnose ASD using ANN and brain signals recorded by an EEG.
Materials and Methods
Study participants
In this study, the brain signals of 45 children were recorded: 34 children with ASD and 11 children without neurodevelopmental disorders aged 3-7 years old. They were all referring to the neurodevelopmental centers in Mashhad City, Iran. The disorder was clinically diagnosed according to the DSM-5 by child psychology specialists and child neurologists. Considering the age symptoms onset of ASD (2.5-3 years) and the lack of diagnosis of ASD until the age of preschool (6-7 years) in Iran, the age range of 3 to 7 years has been determined as the entry criteria for participants in this study. This study used subjects who met all these conditions. In the autism group, the children had ASD diagnoses based on DSM-5 criteria and experts’ approval, aged 3-7 years, with parents’ consent to participate in the research. In the control group, children had no neurodevelopmental disorder (NDD), aged 3-7 years, with the permission of the children’s parents to participate in this research. The exclusion criterion for the ASD group was the diagnosis of comorbid disorder with autism. For the control group, the exclusion criterion was a lack of parental consent regarding the child’s participation in this research.
Electroencephalogram (EEG)
EEG records the electrical activity of brain neurons. EEG is typically utilized to assess the performance of different brain parts. The C3 and C4 electrodes, positioned in the brain’s central region, were employed for this study. These electrodes were chosen because numerous studies have reported that children with ASD have issues in their amygdala. Dysfunction of the amygdala causes turmoil in the child’s visual and auditory system, culminating in the failure to interact socially through eye contact, analyze facial expressions, grasp the person’s condition psychologically, and develop empathy in relationships [22]. Positioning electrodes in the central region is close to the amygdala. Also, placing electrodes in the central region reduces their noise and prevents them from falling unexpectedly. Some children with ASD have tribulation to deal with sensory processing information. Repetitive movements, resistance to touch, and hyperacusis are the most common symptoms. Such behaviors are additionally named sensory integration disorder. As a result, we utilized electrodes in the central regions rather than a cap [23-25]. This study recorded brain signals operating two electrodes with a sampling frequency of 256 Hz positioned in the central region based on the standard 10-20 system.
Artificial neural network (ANN)
ANN is a network of simple neurons that receive inputs and deliver outputs based on their predefined activation functions. ANN is formed by connecting the output of some neurons directly to the input of some other neurons. The weights and functions that compute activation are modified through learning and handled by a learning algorithm [26]. The radial basis function network (RBFN) was employed in this study. RBFN can discriminate and categorize the two groups under concern in the case of the lack of data and when the data of the two groups do not match. RBFN is a type of feed-forward neural network. In RBFN, activator functions are Gaussian [27]. In this study, all coding was done in MATLAB.
Study procedures
Signals were recorded in a small acoustic room with a voice and image control capacity without environmental noises. The children were sitting on a chair facing a monitor. After placing the electrodes on their heads, the brain signals were recorded for 1 minute (the baseline stage). One day before their reference, the children’s parents were asked about their children’s favorite animations. After the baseline stage, signals were recorded for 5 minutes while the children watched the animations (the with-voice stage). Then, the animation voice was muted when the children’s attention was engrossed in the animations. The children’s brain signals were recorded for 5 minutes while watching voiceless animations (the without-voice stage). The sampling frequency equaled 256 Hz in the three recording conditions. It is worth mentioning that the parents of all children had completed the informed consent forms.
The second step aimed to diagnose ASD based on the EEG indices and compare the brain signals of children with and without ASD, and constituted the main study of this research. In this study, all data were investigated by the EEGLAB plugin in MATLAB software after being sorted. Moreover, as much as possible, the software removed apparent noises and muscle artifacts from this experiment. Then, the brain signals were reanalyzed and reinvestigated. With the help of programming codes, the absolute power of the frequency bands (delta [<4 Hz], theta [4-7 Hz], alpha [8-12.5 Hz], mu rhythm [7-10 Hz], beta [13-30 Hz], and gamma [30-48 Hz (low) & 60-100 Hz (high)]) was extracted from the brain signals of the samples. This stage aimed to compare the brain signals of children with ASD and children without any NDD regarding the absolute power of the frequency bands and run a pairwise comparison between the absolute powers of the frequency bands in these two groups. These comparisons were attained through multivariate analysis of covariance (MANCOVA) and discriminant function analysis (DFA).
Next, the absolute power of the frequency bands was applied as the input of the ANN, which produced appropriate output accordingly. In this stage, a radial basis function network was employed as the neural network for classification. This network was used due to the small number of children without any NDD and the disproportionateness of samples between the two groups (11 children in the control group vs 34 children in the ASD group). In the training phase of the ANN, all 45 samples were used to train the ANN with the radial basis function (RBF) algorithm. The network test phase was also run on the same 45 samples. The designed neural network algorithm possessed seven inputs (the absolute power of the frequency bands), and there was an output per input. The neural network output should diagnose if the child has ASD based on the absolute power of the frequency bands. All algorithms were implemented in MATLAB (Figure 1).
Results
The statistical sample includes 34 children with ASD and 11 children without NDD as a control group. In terms of gender distribution, there were 13 girls (5 girls with ASD and 8 girls without NDD) and 32 boys (29 children with ASD and 3 children without NDD). Data analysis was conducted using descriptive statistics such as percentage, frequency, and Mean±SD. The Shapiro-Wilk test was used to assess the data normality, and Levene’s test for homogeneity of variance. The absence of auto-correlation and multicollinearity was evaluated and confirmed. We run the analyses using IBM SPSS software, version 24, at a significance level of P<0.05. In this section, the findings of the MANCOVA are first reported for each channel and at each stage of brain signal recording. Then, graphs are drawn to report each channel’s findings by the frequency bands’ absolute power. To eliminate the effect of the gender variable, it was considered a covariate in MANCOVA.
The results of the MANCOVA test concerning the two brain signal recording stages revealed a significant difference between the children with ASD and those without any NDD in their mu rhythm frequency bands of the left (C3) and right (C4) hemispheres (P<0.05) (Table 1).
The MANCOVA results vividly showed a significant difference between the mean absolute power of the mu rhythm frequency bands of the children with ASD (Mean±SD 4.494±2.680 Hz) and children without NDD (Mean±SD 6.754±2.226 Hz) in the without-voice EEG stage of the left hemisphere (Table 1). There was also a difference in the mean absolute power of the mu rhythm frequency bands of the children with ASD (Mean±SD 4.464±2.290 Hz) and their normal peers (Mean±SD 6.515±3.412 Hz) in the without-voice EEG stage of the right hemisphere (Table 2).
However, the children with ASD (Mean±SD 4.499±2.280 Hz) and those without ASD (Mean±SD 6.759±2.226 Hz) were only different in the with-voice EEG stage of their right hemispheres (Table 3).
The MANCOVA results showed no statistical significance in other band frequencies (delta, theta, alpha, beta, gamma; P>0.05).
Table 4 presents the results of DFA classification in different stages (baseline, with and without voice).
In the baseline EEG stage, DFA results, based on the frequency bands extracted from the brain signals of these children, revealed sensitivities of 44.1% for children without NDD, 55.9% for children with ASD, and 55.6% for separating both groups of children. In the with-voice signal recording stage, the results show sensitivities of 54.4% for children without NDD, 70.6% for children with ASD, and 66.7% for separating the children in both groups. During the without-voice EEG stage, the findings display sensitivities of 63.6% for children without NDD, 70.6% for children with ASD, and 67.6% for separating both groups of children from each other.
In the diagnosis stage, the designed neural network algorithm possesses seven inputs (the absolute powers of the frequency bands), and an output exists per input. If the post-training output of the neural network was <0.5 during the testing of the samples, the considered child is classified into the children without NDD group. Otherwise, the subject was classified into the ASD group (Figure 2).
Discussion
The present study aimed to diagnose ASD using brain signals and ANN. The MANCOVA and DFA results revealed that the mean absolute power of the brain signal frequency bands was useful in determining the brain signal differences of these children and diagnosing ASD. The pairwise comparison of the differences between the frequency bands of the two groups revealed the significance of the frequency bands in diagnosis. On the other hand, since qualitative EEG is the most applied and noninvasive tool for diagnosis, the difference in the absolute power of these children’s brain signals can be an index for early diagnosis [1]
The concept of mirror neurons and their impact on imitating common actions justify the deficiency in social relations in children with ASD. So, the effects of the mu rhythm frequency band on this phenomenon have also been reported in Oberman’s [28] and Bernier’s [29] studies. Oberman conducted a study on 66 individuals with ASD and 51 normal persons without neurodevelopmental disorders in the age range of 6-17 years. They showed that the mu rhythm frequency bands were weakened and suppressed in individuals with ASD and significantly different from normal individuals without NDD. Bernier studied 14 children with ASD and 15 children without NDD. Their results revealed that the EEG mu rhythm of the children with ASD was reduced when observing an imitative task. This research also disclosed a considerable difference between children with ASD and their normal peers in their mean absolute powers of the mu rhythm in both channels but only in with- and without-voice stages.
As one of the notable features of ANN, the algorithm designed in this research can distinguish children with ASD from their normal peers despite some limitations concerning the number of samples. The present research results and other corresponding studies yield well-documented reasons for applying computer-assisted tools for children’s early diagnosis and classification of ASD.
Conclusion
The sample limitations and the inequality of the participants in the two groups were the limitations of this research, considerably impacting the outputs of the statistical and DFA analyses. Although there are some reasons for employing the C3 and C4 channels in recording brain signals, they do not seem to be the most optimal channels for recording the brain signals of children with ASD. Furthermore, this research finding and other studies show that signal recording at rest time or, according to the data of this research, at the baseline stage is sufficient for diagnosing ASD based on frequency bands. It is better to record brain signals in a single stage. So, the output is a clean signal with minimum artifacts and noises with precision. It is suggested that future studies attend to the limitations of this research and take steps for their removal to raise generalizability and approval in clinical environments. Therefore, the results can pave the way for the early diagnosis of ASD and the application of computer-assisted tools in clinical environments.
Ethical Considerations
Compliance with ethical guidelines
All study procedures were in compliance with the ethical guidelines of the Declaration of Helsinki 2013.
Informed Consent
All parents provided informed consent of their satisfaction with their children’s participation in this research.
Funding
This research is derived from the master’s thesis of Mitra Dadjoo approved by the University of Guilan (Code: 68467).
Authors contributions
Conceptualization, validation, and methodology: Mitra Dadjoo and Sajjad Rezaei; Software and resources; Sajjad Rezaei, Kambiz Rohampour, and Ghasem Sadeghi Bajestani; Formal analysis; Mitra Dadjoo, Sajjad Rezaei, and Kambiz Rohampour; Supervision, investigation, and data curation; All authors, Writing the original draft preparation; Mitra Dadjoo; Review, and editing; Mitra Dadjoo, Sajjad Rezaei, Kambiz Rohampour, and Ashkan Naseh.
Conflict of interest
The authors declared no conflict of interest.
Acknowledgements
The authors would like to thank all the members of University of Guilan and Imam Reza International University for their assistance in this study.
References
- American Psychiatric Association. Diagnostic and statistical manual of mental disorders DMS-5. Virginia: American Psychiatric Association; 2013. [DOI:10.1176/appi.books.9780890425596]
- Bogéa Ribeiro L, da Silva Filho M. Systematic review on EEG analysis to diagnose and treat autism by evaluating functional connectivity and spectral power. Neuropsychiatr Dis Treat. 2023; 19:415-24. [DOI:10.2147/NDT.S394363] [PMID]
- Djemal R, AlSharabi K, Ibrahim S, Alsuwailem A. EEG-based computer aided diagnosis of autism spectrum disorder using Wavelet, Entropy, and ANN. Biomed Res Int. 2017; 2017:9816591. [DOI:10.1155/2017/9816591] [PMID]
- Grossi E, Olivieri C, Buscema M. Diagnosis of autism through EEG processed by advanced computational algorithms: A pilot study. Comput Methods Programs Biomed. 2017; 142:73-9. [DOI:10.1016/j.cmpb.2017.02.002] [PMID]
- Bosl WJ, Tager-Flusberg H, Nelson CA. EEG analytics for early detection of autism spectrum disorder: A data-driven approach. Sci Rep. 2018; 8(1):6828. [DOI:10.1038/s41598-018-24318-x] [PMID]
- Alves CL, Toutain TGLO, de Carvalho Aguiar P, Pineda AM, Roster K, Thielemann C, et al. Diagnosis of autism spectrum disorder based on functional brain networks and machine learning. Sci Rep. 2023; 13(1):8072. [PMID]
- Bosl W, Tierney A, Tager-Flusberg H, Nelson C. EEG complexity as a biomarker for autism spectrum disorder risk. BMC Med. 2011; 9:18. [DOI:10.1186/1741-7015-9-18] [PMID]
- Boutros NN, Lajiness-O’Neill R, Zillgitt A, Richard AE, Bowyer SM. EEG changes associated with autistic spectrum disorders. Neuropsychiatr Electrophysiol. 2015; 1(1):1-20. [DOI:10.1186/s40810-014-0001-5]
- Sheikhani A, Behnam H, Noroozian M, Mohammadi MR, Mohammadi M. Abnormalities of quantitative electroencephalography in children with Asperger disorder in various conditions. Res Autism Spectr Disord. 2009; 3(2):538-46. [DOI:10.1016/j.rasd.2008.11.002]
- Hadoush H, Alafeef M, Abdulhay E. Automated identification for autism severity level: EEG analysis using empirical mode decomposition and second order difference plot. Behav Brain Res. 2019; 362:240-8. [DOI:10.1016/j.bbr.2019.01.018] [PMID]
- Grice SJ, Spratling MW, Karmiloff-Smith A, Halit H, Csibra G, de Haan M, et al. Disordered visual processing and oscillatory brain activity in autism and Williams syndrome. Neuroreport. 2001; 12(12):2697-700. [DOI:10.1097/00001756-200108280-00021] [PMID]
- Bosl WJ, Loddenkemper T, Nelson CA. Nonlinear EEG Biomarker profiles for autism and absence epilepsy. Neuropsychiatr Electrophysiol. 2017; 3(1):1-22. [DOI:10.1186/s40810-017-0023-x]
- Mohammad-Rezazadeh I, Frohlich J, Loo SK, Jeste SS. Brain connectivity in autism spectrum disorder. Curr Opin Neurol. 2016; 29 (2):137-47. [DOI:10.1097/WCO.0000000000000301] [PMID]
- Khan IY, Zope PH, Suralkar SR. Importance of artificial neural network in medical diagnosis disease like acute nephritis disease and heart disease. Int J Eng Sci Innov Technol. 2013; 2(2):210-7. [Link]
- Lanillos P, Oliva D, Philippsen A, Yamashita Y, Nagai Y, Cheng G. A review on neural network models of schizophrenia and autism spectrum disorder. Neural Netw. 2020; 122:338-63. [DOI:10.1016/j.neunet.2019.10.014] [PMID]
- Pham TH, Vicnesh J, Wei JKE, Oh SL, Arunkumar N, Abdulhay EW, et al. Autism spectrum disorder diagnostic system using HOS bispectrum with EEG signals. Int J Environ Res Public Health. 2020; 17(3):971. [DOI:10.3390/ijerph17030971] [PMID]
- Mueller A, Candrian G, Kropotov JD, Ponomarev VA, Baschera GM. Classification of ADHD patients on the basis of independent ERP components using a machine learning system. Nonlinear Biomed Phys. 2010; 4(Suppl 1):S1. [DOI:10.1186/1753-4631-4-S1-S1] [PMID]
- Heinsfeld AS, Franco AR, Craddock RC, Buchweitz A, Meneguzzi F. Identification of autism spectrum disorder using deep learning and the ABIDE dataset. Neuroimage Clin. 2018; 17:16-23. [DOI:10.1016/j.nicl.2017.08.017] [PMID]
- Bi XA, Wang Y, Shu Q, Sun Q, Xu Q. Classification of autism spectrum disorder using random support vector machine cluster. Front Genet. 2018; 9:18. [DOI:10.3389/fgene.2018.00018] [PMID]
- Rashidi M, Behnam H, Sheikhani A, Mohammadi MR, Norouzian M. [Evaluation of EEG signal in autism disorder with ICA analysis (Persian)]. Iran J Biomed Eng. 2010; 4(3):187-94. [Link]
- Dabirvaziri A, Tehranizadeh M. [Prediction of autism disorder by artificial neural network (Persian)]. J Res Behav Sci. 2018; 16(4):489-98. [DOI:10.52547/rbs.16.4.489]
- Zalla T, Sperduti M. The amygdala and the relevance detection theory of autism: An evolutionary perspective. Front Hum Neurosci. 2013; 7:894. [DOI:10.3389/fnhum.2013.00894] [PMID]
- Hojjati M, Sadeghi Bejestani G, Ashrafzadeh F. Investigation on the effectiveness of holistic multi-dimensional treatment model (HMTM) in improvement of CARS test indicators in children suffering from autism spectrum disorder. Int J Pediatr. 2015; 3(2.2):543-53. [Link]
- Bajestani GS, Behrooz M, Khani AG, Nouri-Baygi M, Mollaei A. Diagnosis of autism spectrum disorder based on complex network features. Comput Methods Programs Biomed. 2019; 177:277-83. [DOI:10.1016/j.cmpb.2019.06.006] [PMID]
- Grossi E, Valbusa G, Buscema M. Detection of an autism EEG signature from only two EEG channels through features extraction and advanced machine learning analysis. Clin EEG Neurosci. 2021; 52(5):330-7. [DOI:10.1177/1550059420982424] [PMID]
- Ohno-Machado L. Medical applications of artificial neural networks: connectionist models of survival [PhD dissertation]. Stanford: Stanford University; 1996. [Link]
- Faris H, Aljarah I, Mirjalili S. Evolving radial basis function networks using moth-flame optimizer. In: Samui P, Sekhar S, Balas VE, editors. Handbook of neural computation. Massachusetts: Academic Press; 2017. [Link]
- Oberman LM, McCleery JP, Hubbard EM, Bernier R, Wiersema JR, Raymaekers R, et al. Developmental changes in mu suppression to observed and executed actions in autism spectrum disorders. Soc Cogn Affect Neurosci. 2013; 8(3):300-4. [DOI:10.1093/scan/nsr097] [PMID]
- Bernier R, Dawson G, Webb S, Murias M. EEG mu rhythm and imitation impairments in individuals with autism spectrum disorder. Brain Cogn. 2007; 64(3):228-37. [DOI:10.1016/j.bandc.2007.03.004] [PMID]
Type of Study: Research |
Subject:
Special
Received: 2023/10/7 | Accepted: 2024/01/10 | Published: 2024/01/10
Received: 2023/10/7 | Accepted: 2024/01/10 | Published: 2024/01/10
Send email to the article author
| Rights and permissions | |
 | This work is licensed under a Creative Commons Attribution-NonCommercial 4.0 International License. |

Copyright © The Author(s);
This is an open access article distributed under the terms of the Creative Commons Attribution License (CC-By-NC), which permits use, distribution, and reproduction in any medium, provided the original work is properly cited and is not used for commercial purposes.
Contact Information