Sat, May 18, 2024
Volume 9, Issue 2 (Spring 2023)
Caspian J Neurol Sci 2023, 9(2): 78-91 |
Back to browse issues page


Download citation:
BibTeX | RIS | EndNote | Medlars | ProCite | Reference Manager | RefWorks
Send citation to:


BibTeX | RIS | EndNote | Medlars | ProCite | Reference Manager | RefWorks
Send citation to:
Sheibani R, Sadeghi Bajestani G, Goshvarpour A. Study of Interactive Variation Between Brain and Heart Signals While Listening to the Holy Quran by Fusion Technique. Caspian J Neurol Sci 2023; 9 (2) :78-91
URL: http://cjns.gums.ac.ir/article-1-614-en.html
URL: http://cjns.gums.ac.ir/article-1-614-en.html


1- Department of Biomedical Engineering, Faculty of Biomedical Engineering, Imam Reza International University, Mashhad, Razavi Khorasan, Iran
2- Health Technology Research Center, Faculty of Biomedical Engineering, Imam Reza International University, Mashhad, Razavi Khorasan, Iran
2- Health Technology Research Center, Faculty of Biomedical Engineering, Imam Reza International University, Mashhad, Razavi Khorasan, Iran
Full-Text [PDF 2457 kb]
(508 Downloads)
| Abstract (HTML) (658 Views)
Full-Text: (148 Views)
Introduction
Throughout history, people around the world have listened to music for a variety of reasons. They used auditory stimuli such as music to change emotions, reduce stress, and treat neurological diseases such as schizophrenia, autism, and so on [1, 2]. One of the points that should be considered in the clinical application of auditory stimuli is adapting the type of sound to the beliefs and interests of the people. In Islamic countries, the Holy Quran that Muslims experience a kind of pleasure and peace by reading or listening to it, can affect the emotional and physiological states of Muslims [3]. Many published articles have pointed out the relationship between human emotions and their neuro-physiological system [4]. It has often been shown that the brain is involved in religious experiences. Hearing the sound of the Quran increases blood flow to parts of the brain [5]. The spectral power of brain waves changes depending on the type of musical stimulus [6]. As stated in some literature, auditory stimuli with different emotional content affect the central nervous system (CNS), peripheral nervous system (PNS), and heart rate (HR) patterns [7, 8]. For example, Goshvarpour et al. and Naji et al. used electroencephalogram waves to study the effect of sound on the CNS [9, 2]. In some other articles, the effect of auditory stimulation (like the sound of the Quran and music) on the PNS was examined utilizing heart waves [7, 10]. Therefore, the present study used EEG and ECG waves to investigate the beneficial effect of Quran sound on humans.
There are many ways to analyze a signal. For example, based on the power spectrum, the amplitude of the alpha wave rises when reading the Quran more than when reading a book [11]. In care applications, time analysis methods are used where it is important to perform fast processing operations. Frequency analysis of biosignals, especially brain signals, is also widely used [12, 13, 14, 15]. According to Heisenberg's uncertainty principle, the accuracy of time and frequency analysis cannot be increased simultaneously [16]. Therefore, they used the short-time Fourier transform (STFT) in research [17]. It has recently been shown that in cases where EEG is considered the output of a linear system, limited information is obtained from the signal because the biological signals are non-stationary, nonlinear, and chaotic. So nonlinear techniques in recent years provide better insight into the signal [18, 19].
Some indicators consider geometric shapes for evaluating time series, such as fractal dimension indices that assess the evolutionary properties and relevance of the signal's dynamic. Padial et al. used Higuchi fractal dimension to analyze brain signals in different emotional states. They found that dimensional complexity is higher in all emotional states than in the neutral state [20]. In another study, Higuchi's fractal dimension (HFD) and Katz's fractal dimension (KFD) were used to discriminate between encephalopathic patients and healthy individuals. The results showed that HFD had a better performance [21]. The researchers also used HFD and sample entropy (a measure of time series disorder and complexity) to separate healthy and depressed individuals. Their results showed the comparable effectiveness of both techniques in classifying healthy and sick people. In a recent study that used entropy, the researchers reported that the sample entropy increased when hearing the sound of the Quran or inducing emotional states [4, 5, 8]. Entropy obtained from EEG of healthy individuals has also been reported to be higher than that of patients [22, 23]. In recent years, other chaotic processing methods, such as the Poincaré section, have been used to understand the behavior and dynamics of time series in a biological system. The Poincaré section provides a qualitative visualization of a time series in two-dimensional space. In the article [24], the researchers used the lagged Poincaré plot to discriminate EEG emotional states of healthy individuals.
Some scientists have studied biological signals separately. Since emotional stimulation causes physiological stimulation in the heart, brain, or body vital signs, considering the interaction between these signals or their characteristics can provide valuable information for recognizing emotions. In information processing, sometimes it is necessary to combine information from different data sources to improve the results and the system performance, which is called the fusion technique [25]. However, few studies have used fusion techniques. Different fusion methods introduced in previous articles are used depending on the type of application. Fusion is usually examined at three levels: data, feature, and decision [26, 27]. In one article [15], for fusion, Bayesian-based theory has been used to combine the decision-making of heart rate variability (HRV) and pulse rate variability signal classifiers. Koelstra et al. used fusion at the feature and decision level to examine the effect of individuals' emotional states [28]. Also, the results of another article [7] show that by applying feature fusion, the classification accuracy increases to 100%. Finally, in other studies that have used the fusion, the percentage of classification accuracy increased.The upper level of the cerebral cortex is constantly interacting with the visceral organs by transmitting information. Additionally, cortical and subcortical brain networks regulate autonomic activities. The brain continuously sends commands to internal parts such as the heart. On the other hand, heart activity is embedded in the upper cortical level functions, which can be found in emotions, cognition, and sensory-motor meanings. In this study, we assumed that the evaluation of each parameter separately does not provide enough information about our body conditions, and we intended to use a combination of their information. On the other hand, the interaction between the brain and heart is affected by various factors such as stress, fear, and the like. To regulate or achieve the desired physical and mental states, such as relaxation, sound, and music stimulations have been used frequently. Our goal was to evaluate the effect of listening to the Holy Quran verses on the performance of these parameters.
In the present study, the advantage of combining the features extracted from the complementary plot of heart and brain signals when hearing the sound of the Holy Quran has been proposed for the first time.
Materials and Methods
First, EEG and ECG signals were recorded simultaneously in three different stages to study the effect of listening to the Quran. To investigate the impact of interactive variation, we used the fusion technique at the feature level, and the effectiveness of this technique was determined by applying classification in two stages. Therefore, after constructing the signal’s standard complementary plot, the number of the cut-off points with circular sections is obtained, and some features were extracted from them. The classification of all possible states of brain and heart signals was done in three different stages. In the second part, after the fusion of the features extracted from the heart and brain signals, the classification was done. The study steps are shown in Figure 1 and Figure 2.
.jpg)
.jpg) Data collection
Data collection
Study participants
EEG and ECG signals were recorded from participants while lying on the bed in a supine position and closing their eyes. The recording process consists of three stages lasting five minutes. The first (Baseline [B]) and third (with no voice [WNV]) stages are performed in silence. In contrast, in the second stage (with voice [WV]) while the sound of the Quran is played by headphones. The initial subjects included 30 female students aged between 20 and 23 years. Owing to excessive artifacts and signal changes of the sudden movement of the participants, five samples were excluded from this study. The final number of subjects was 25 samples. All participants were healthy, and no one reported specific illnesses such as heart disease, high blood pressure, and epilepsy. Before starting work, the test was explained to them, and they were requested to sign the consent form. Then, the signal was recorded.
Auditory stimuli
The sound of the Quran’s reciting was played to the participants by an experienced reciter in the experiment’s second phase. In this study, verses 20 to 35 of Surah Ra’d from the Quran have been selected by a religious expert. The content of these verses refers to God’s monotheism and the Quran’s legitimacy. In verse 28, it is stated that the peace of the human heart depends on the remembrance of God.
Data recording
Biosignals were acquired using the FlexComp Infiniti device. The sampling rate was 2048 Hz, and its resolution was 14 bits. This device had a hardware notch filter with a cut-off frequency of 60 Hz. The EEG signals were recorded according to the 10-20 international system from the two regions of C3 and C4. Electrodes A1 and A2 (on ears) were selected as the reference. In all stages of the test, the impedance of the electrodes was less than 5 kΩ. Also, three electrodes were used to record ECG signals on the chest. The participant was asked to lift their shirt and place the yellow electrode below the ribs on the right and the blue electrode at the same level on the left. The black electrode can go anywhere, but a good location is the upper sternum area. In the preprocessing stage, no digital filter was applied to remove possible artifacts. Only in this section, the first two minutes of the time series without artifacts and noise were selected. Then, we partitioned the EEG signals into segments of 10 s without overlap (the smallest frequency of EEG signals was 0.1 Hz) [29]. The signal recording was performed in the Physiology Laboratory of Imam Reza International University (Mashhad City, Iran).
Feature extraction
In this research, we used a new method of nonlinear analysis based on phase space reconstruction to extract features, which is explained in the following sections.
Standard complementary plot
In the first step, we represent the time series in a suitable space. For this reason, we use a complementary plot that eliminates the effect of point amplitude and pays attention to its phase. To this end, we first normalized each segment (10 seconds of the time series) between -1 and 1. Then, we quantize the normalized processes to N levels. Finally, to construct the complement plot, we calculate the sine and cosine of each part of the quantized surface, and we connect the points with a hypothetical line. According to the research of Karimi et al. [29], by considering N=100, mandala-like patterns are created. Each part of the quantized surfaces is obtained by Equation 1 [29]
.jpg)
, Where S is a segment and Sq is a quantized segment. The sine and cosine of each part of the signal are calculated as follows by Equation 2.

Figure 3 shows the complementary plot of a segment of the brain and heart signal of a healthy person when hearing the sound of the Quran.
.jpg) You can see mandala-like patterns or concentric rings in the image [16،we propose a feature extraction method based on discrete wavelet transform (DWT29].
You can see mandala-like patterns or concentric rings in the image [16،we propose a feature extraction method based on discrete wavelet transform (DWT29].
Circular cross-section
Then, to extract the feature, we match a circle with radius r (r=0.1, 0.2, 0.3, 0.4, 0.5, 0.6, 0.7, 0.8, 0.9, 1) on the standard complement plot and the vector of the number of points of intersection of the hypothetical lines of mandala patterns with a circular cross-section is obtained for different radii.
Fusion
A fusion technique that improves system performance has been used in this research. Fusion at the data level is performed on raw data, which is performed immediately after data collection from the sensor. If the input is a feature and the output is a feature, this process is called feature fusion or information fusion. And fusion at the decision level is obtained by combining the results of the decision of each data source. Feature fusion was obtained by combining the feature vectors of brain and heart signals, and the unit feature vector was given to the Classifier's input. To this effect, standard complementary plots of both brain and heart signals are drawn in one plot, and the sum of the intersection points of a circular section with radius r was calculated with the hypothetical lines of the standard complementary plots of brain and heart signals. Finally, the fused feature vector was obtained.
Classification
Our suggestion for classification is the support vector machine classifier. It is a supervised classification that distinguishes between two classes by an optimal hyper-plane with a maximum margin. SVM is one of the most commonly used classifiers in pattern recognition, biomedical studies, and neuroscience. In this work, the radial basis function (RBF) kernel has been used in SVM. In this research, we classify each pair of three signal recording modes, including B, WV, and WNV. Also, after applying the fusion, we gave the fused feature vector to the input of the SVM classifier and compared the results of the fusion classification with the previous step. The classifier’s performance was evaluated based on the calculation of sensitivity, specificity, and accuracy.
Results
In this step, after preprocessing the data and drawing the complementary plot, circles with different radii were drawn on the complementary plot, and the number of intersection points of the circle with the hypothetical lines was classified as feature vectors. We had three steps of signal recording using the SVM classifier, which was classified between two classes, and 9 different modes were created (Table 1).
.jpg)
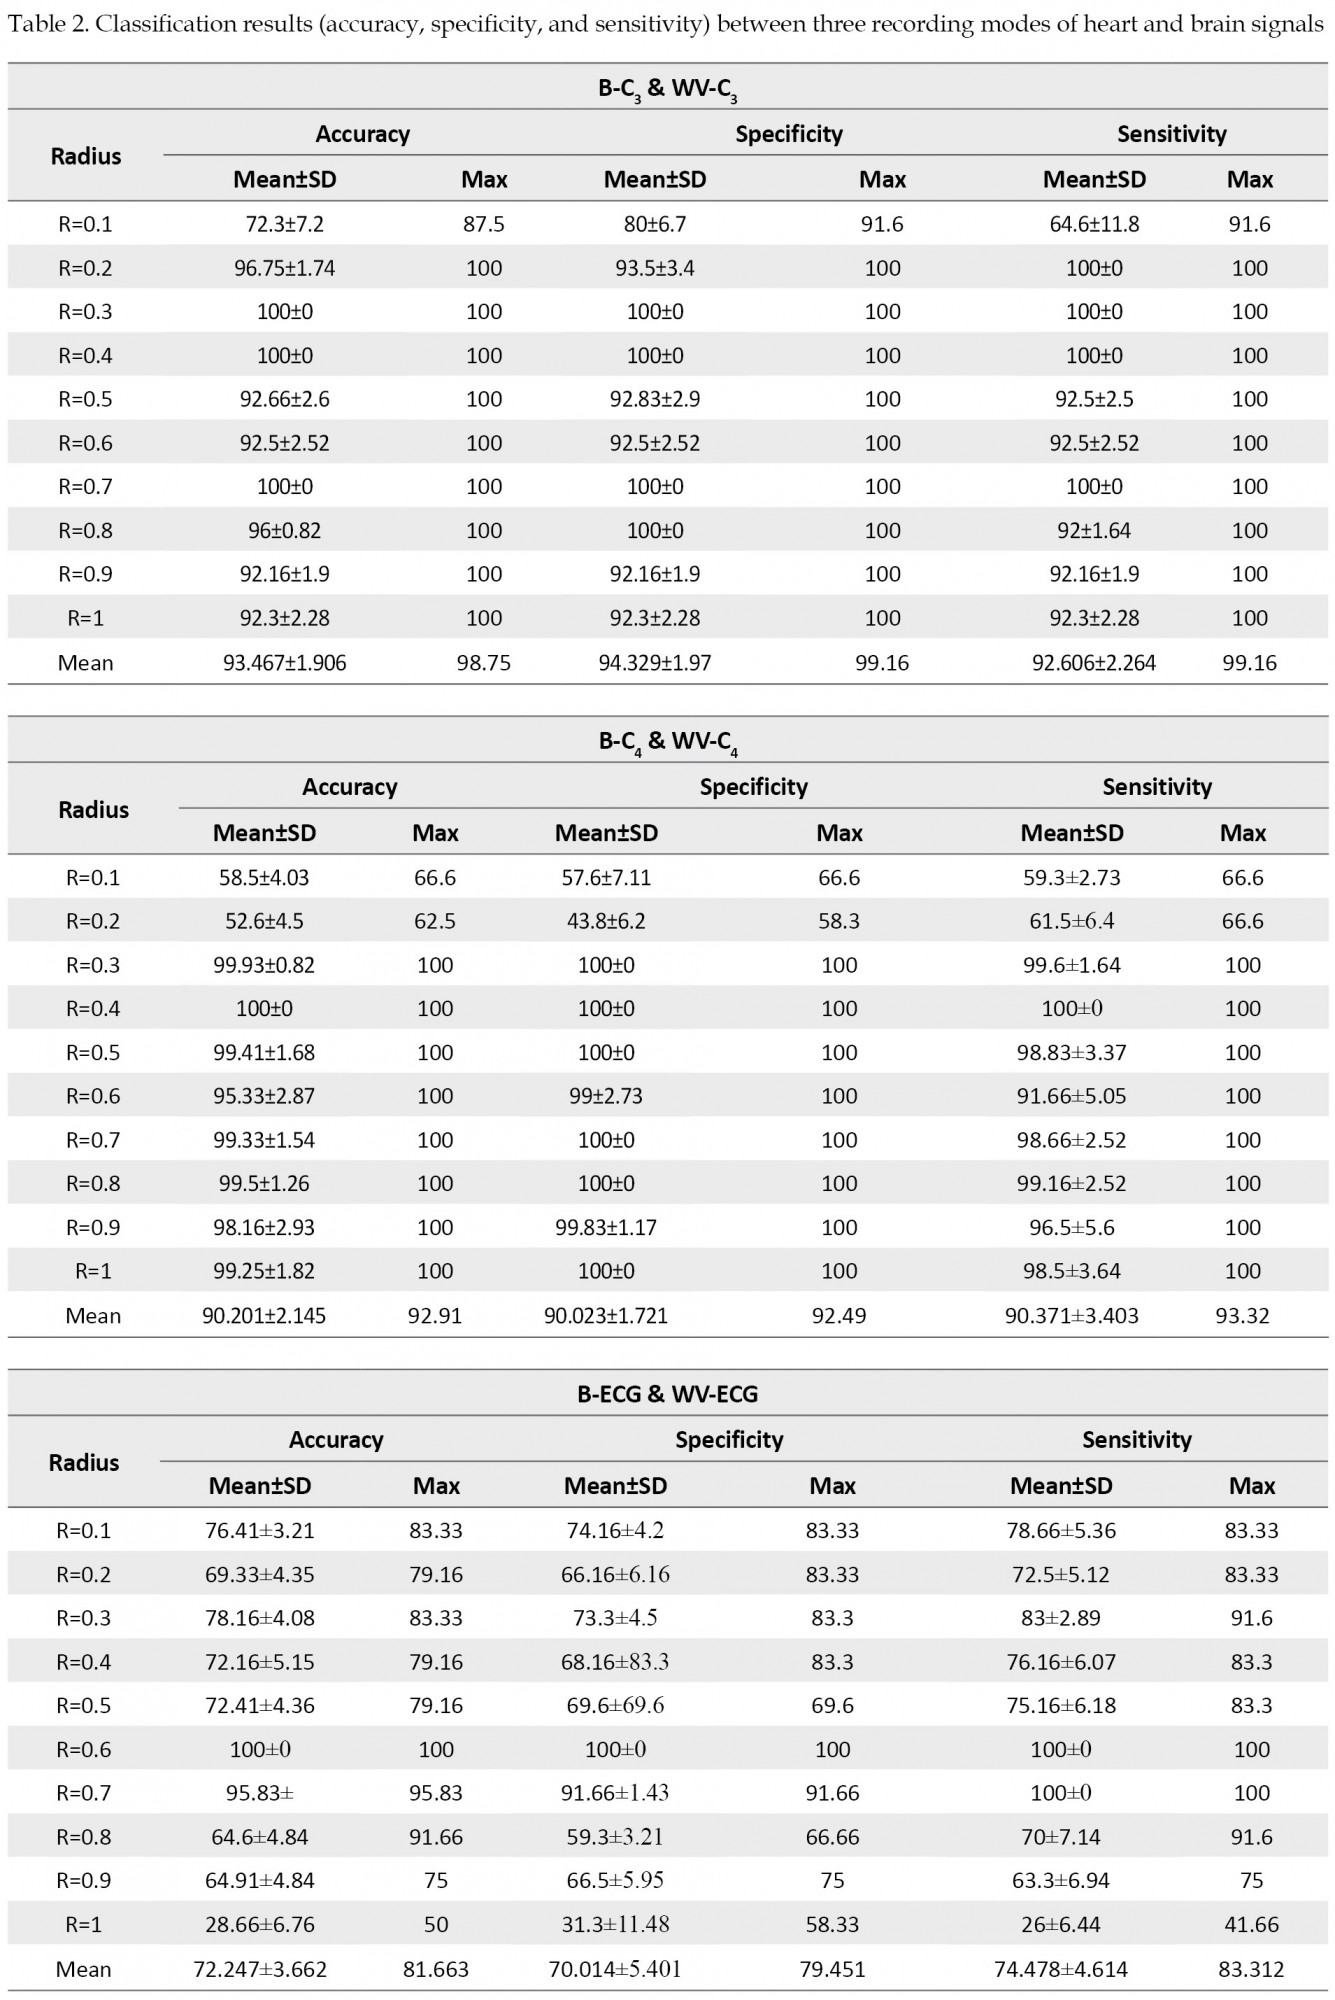
The classification results of the different stages are reported below (Table 2).


To evaluate the classification performance by considering the feature fusion, the sum of the intersection points obtained from the circular intersection with radius r with a complement plot of heart and brain signals was stored in a feature vector and was given to the input of the SVM classifier. The classification results of the feature fusion are reported in Table 3.
.jpg)
.jpg)
.jpg)
According to the results (Tables 2 and 3), a maximum accuracy of 98.75% was achieved for C3 signals in B and WV classes. In addition, the best classification rate of 93.74% was obtained for C4 in the B and WNV classes. Also, the highest accuracy rate for ECG was 89.15% in B and WNV classes. Applying the proposed feature fusion methodology, the performances of the classifiers were improved significantly compared with considering each signal separately. The maximum state classification of 97.49% is attained feature fusion technique for C3 and ECG in B and WV classes. Regarding this technique, the highest classification accuracy was reached for the combination of C4 and ECG at 94.99% in B and WNV. Totally the lowest recognition rates were perceived by ECG signals separately. However, the lowest average accuracy value for ECG was 72.24% in B and WV classes, which increased to more than 90% when combined with any of the brain signals.
The specificity criterion, one of the evaluation criteria of the classifier, pays attention only to the true negative (TN). An ideal test has 100% specificity. Based on the specificity criterion, we conclude that the maximum average specificity is Mean±SD 94.32±1.97 for C3 in B and WV classes. The average specificity criterion for ECG was lower than that of EEG, which was improved by applying the fusion technique.
The sensitivity criterion, one of the evaluation criteria of the classifier, pays attention only to the true positive (TP). An ideal test has 100% sensitivity. Based on the sensitivity criterion, we conclude that the maximum average sensitivity WITH Mean±SD 2.06±2.26 for C3 in B and WV classes. The average sensitivity criterion for ECG was lower than that of EEG, which was improved by applying the fusion technique.
All the results reported above were the mean of the classification results in circles with radii of 0.1 to 1. If we look at it on a case-by-case basis, we will see that the best classification result is for C3 in the B and WV classes because by considering the intersection of complementary plots with circles with a radius of 0.2 to 1, the values of accuracy, specificity, and sensitivity were reported 100%. Finally, in all cases, the higher classification rates are identified by utilizing feature fusion. Generally, the results of fusion frameworks outperform the single signal-based approaches.
Discussion
In recent years, spirituality has played an influential role in human health. However, few studies have been done on the physiological effects of listening to the Quran. Some researchers have challenged this topic by employing different physiological signals, such as EEG and various methods. They usually examined brain signals isolated [5] or used one or more biosignals separately to assess unalike emotional states, even though there is an interaction between physiological systems [20]. Therefore, investigating fusion approaches by different physiological signals shows the interactive variation while improving the classifier’s performance.
This paper presented the effect of listening to the Holy Quran on the brain and heart signals simultaneously by examining different modes of signal recording and using a new feature fusion approach based on the phase space of the heart and brain signals. SVM has shown that the fusion method outperformed the EEG or ECG signals separately. Maximum accuracy of 98.75% was achieved by C3 for separating B and WV classes. The highest accuracy for ECG was 89.15% for discerning classes B and WNV. In general, the lowest classification was perceived by ECG signals separately. Using the proposed feature combination method, the performance of the classifiers was significantly improved compared to considering each signal alone. The maximum rate of 97.49% was obtained by fusing the C3 and ECG for discriminating between classes B and WV. Previously, the accuracy of the proposed system for listening to the Quran with a heart signal was 91.6% [30]. Goshvarpour et al. reported that the highest accuracy rate for detecting emotions caused by the sound of music was 81.82% for the GSR signal [25] a novel fusion framework based on wavelet transform (WT. Soroush et al. obtained 82% accuracy in classifying emotions through the phase space of the brain signal [19]. The fusion technique has been commonly used to improve system performance. In another paper, Goshvarpour et al., who combined HRV and variability PRV signals to detect emotions with the Poincaré plot method, reported 79.68% accuracy for feature-level fusion and 82.9% for decision-level fusion [15]. In another article [4] an approach is proposed for recognizing music-induced emotions through the fusion of three-channel forehead biosignals (the left temporalis, frontalis, and right temporalis channels, forehead biosignals and electrocardiograms were applied to detect emotions. The researchers used feature-level fusion, which resulted in 88.78% accuracy.
Conclusions
In this research, we investigated the effect of listening to the Holy Quran on the heart and brain signals of healthy participants. To this effect, we used a new approach to integrate the phase space of brain and heart signals. Moreover, by creating innovation in the way of data collection, including the simultaneous recording of heart and brain signals and investigating the innovative fusion technique, we took a step toward future research progress. The results showed a significant change in the brain signals of people while listening to the Quran (WV) compared to the state of silence (B) (maximum accuracy was 98.75% for C3). The highest difference was between the B state and the WNV state. Also, there was the least difference between WV and WNV, which shows that the effect of the sound of the Quran remains for a few moments after listening. The fusion technique has been effective in processing information and improving system performance. Our results, compared to other studies, confirmed the effectiveness of the fusion technique of physiological signals when listening to the Holy Quran.
Ethical Considerations
Compliance with ethical guidelines
All study procedures were done in compliance with the ethical guidelines of the 2013 Declaration of Helsinki. This article was approved by the Ethics Committee of Imam Reza International University (Ethical Code: IR.IMAMREZA.REC.1401.007).
Funding
This research did not receive any grant from funding agencies in the public, commercial, or non-profit sectors.
Authors contributions
Conceptualization and methodology, writing, review, and editing: All Authors; Investigation and writing the original draft: Roya Sheibani; Resources and supervision: Ghasem Sadeghi Bajestani and Ateke Goshvarpour.
Conflict of interest
The authors declared no conflict of interest.
Acknowledgements
The authors thank those who participated in this study.
References
Throughout history, people around the world have listened to music for a variety of reasons. They used auditory stimuli such as music to change emotions, reduce stress, and treat neurological diseases such as schizophrenia, autism, and so on [1, 2]. One of the points that should be considered in the clinical application of auditory stimuli is adapting the type of sound to the beliefs and interests of the people. In Islamic countries, the Holy Quran that Muslims experience a kind of pleasure and peace by reading or listening to it, can affect the emotional and physiological states of Muslims [3]. Many published articles have pointed out the relationship between human emotions and their neuro-physiological system [4]. It has often been shown that the brain is involved in religious experiences. Hearing the sound of the Quran increases blood flow to parts of the brain [5]. The spectral power of brain waves changes depending on the type of musical stimulus [6]. As stated in some literature, auditory stimuli with different emotional content affect the central nervous system (CNS), peripheral nervous system (PNS), and heart rate (HR) patterns [7, 8]. For example, Goshvarpour et al. and Naji et al. used electroencephalogram waves to study the effect of sound on the CNS [9, 2]. In some other articles, the effect of auditory stimulation (like the sound of the Quran and music) on the PNS was examined utilizing heart waves [7, 10]. Therefore, the present study used EEG and ECG waves to investigate the beneficial effect of Quran sound on humans.
There are many ways to analyze a signal. For example, based on the power spectrum, the amplitude of the alpha wave rises when reading the Quran more than when reading a book [11]. In care applications, time analysis methods are used where it is important to perform fast processing operations. Frequency analysis of biosignals, especially brain signals, is also widely used [12, 13, 14, 15]. According to Heisenberg's uncertainty principle, the accuracy of time and frequency analysis cannot be increased simultaneously [16]. Therefore, they used the short-time Fourier transform (STFT) in research [17]. It has recently been shown that in cases where EEG is considered the output of a linear system, limited information is obtained from the signal because the biological signals are non-stationary, nonlinear, and chaotic. So nonlinear techniques in recent years provide better insight into the signal [18, 19].
Some indicators consider geometric shapes for evaluating time series, such as fractal dimension indices that assess the evolutionary properties and relevance of the signal's dynamic. Padial et al. used Higuchi fractal dimension to analyze brain signals in different emotional states. They found that dimensional complexity is higher in all emotional states than in the neutral state [20]. In another study, Higuchi's fractal dimension (HFD) and Katz's fractal dimension (KFD) were used to discriminate between encephalopathic patients and healthy individuals. The results showed that HFD had a better performance [21]. The researchers also used HFD and sample entropy (a measure of time series disorder and complexity) to separate healthy and depressed individuals. Their results showed the comparable effectiveness of both techniques in classifying healthy and sick people. In a recent study that used entropy, the researchers reported that the sample entropy increased when hearing the sound of the Quran or inducing emotional states [4, 5, 8]. Entropy obtained from EEG of healthy individuals has also been reported to be higher than that of patients [22, 23]. In recent years, other chaotic processing methods, such as the Poincaré section, have been used to understand the behavior and dynamics of time series in a biological system. The Poincaré section provides a qualitative visualization of a time series in two-dimensional space. In the article [24], the researchers used the lagged Poincaré plot to discriminate EEG emotional states of healthy individuals.
Some scientists have studied biological signals separately. Since emotional stimulation causes physiological stimulation in the heart, brain, or body vital signs, considering the interaction between these signals or their characteristics can provide valuable information for recognizing emotions. In information processing, sometimes it is necessary to combine information from different data sources to improve the results and the system performance, which is called the fusion technique [25]. However, few studies have used fusion techniques. Different fusion methods introduced in previous articles are used depending on the type of application. Fusion is usually examined at three levels: data, feature, and decision [26, 27]. In one article [15], for fusion, Bayesian-based theory has been used to combine the decision-making of heart rate variability (HRV) and pulse rate variability signal classifiers. Koelstra et al. used fusion at the feature and decision level to examine the effect of individuals' emotional states [28]. Also, the results of another article [7] show that by applying feature fusion, the classification accuracy increases to 100%. Finally, in other studies that have used the fusion, the percentage of classification accuracy increased.The upper level of the cerebral cortex is constantly interacting with the visceral organs by transmitting information. Additionally, cortical and subcortical brain networks regulate autonomic activities. The brain continuously sends commands to internal parts such as the heart. On the other hand, heart activity is embedded in the upper cortical level functions, which can be found in emotions, cognition, and sensory-motor meanings. In this study, we assumed that the evaluation of each parameter separately does not provide enough information about our body conditions, and we intended to use a combination of their information. On the other hand, the interaction between the brain and heart is affected by various factors such as stress, fear, and the like. To regulate or achieve the desired physical and mental states, such as relaxation, sound, and music stimulations have been used frequently. Our goal was to evaluate the effect of listening to the Holy Quran verses on the performance of these parameters.
In the present study, the advantage of combining the features extracted from the complementary plot of heart and brain signals when hearing the sound of the Holy Quran has been proposed for the first time.
Materials and Methods
First, EEG and ECG signals were recorded simultaneously in three different stages to study the effect of listening to the Quran. To investigate the impact of interactive variation, we used the fusion technique at the feature level, and the effectiveness of this technique was determined by applying classification in two stages. Therefore, after constructing the signal’s standard complementary plot, the number of the cut-off points with circular sections is obtained, and some features were extracted from them. The classification of all possible states of brain and heart signals was done in three different stages. In the second part, after the fusion of the features extracted from the heart and brain signals, the classification was done. The study steps are shown in Figure 1 and Figure 2.
Study participants
EEG and ECG signals were recorded from participants while lying on the bed in a supine position and closing their eyes. The recording process consists of three stages lasting five minutes. The first (Baseline [B]) and third (with no voice [WNV]) stages are performed in silence. In contrast, in the second stage (with voice [WV]) while the sound of the Quran is played by headphones. The initial subjects included 30 female students aged between 20 and 23 years. Owing to excessive artifacts and signal changes of the sudden movement of the participants, five samples were excluded from this study. The final number of subjects was 25 samples. All participants were healthy, and no one reported specific illnesses such as heart disease, high blood pressure, and epilepsy. Before starting work, the test was explained to them, and they were requested to sign the consent form. Then, the signal was recorded.
Auditory stimuli
The sound of the Quran’s reciting was played to the participants by an experienced reciter in the experiment’s second phase. In this study, verses 20 to 35 of Surah Ra’d from the Quran have been selected by a religious expert. The content of these verses refers to God’s monotheism and the Quran’s legitimacy. In verse 28, it is stated that the peace of the human heart depends on the remembrance of God.
Data recording
Biosignals were acquired using the FlexComp Infiniti device. The sampling rate was 2048 Hz, and its resolution was 14 bits. This device had a hardware notch filter with a cut-off frequency of 60 Hz. The EEG signals were recorded according to the 10-20 international system from the two regions of C3 and C4. Electrodes A1 and A2 (on ears) were selected as the reference. In all stages of the test, the impedance of the electrodes was less than 5 kΩ. Also, three electrodes were used to record ECG signals on the chest. The participant was asked to lift their shirt and place the yellow electrode below the ribs on the right and the blue electrode at the same level on the left. The black electrode can go anywhere, but a good location is the upper sternum area. In the preprocessing stage, no digital filter was applied to remove possible artifacts. Only in this section, the first two minutes of the time series without artifacts and noise were selected. Then, we partitioned the EEG signals into segments of 10 s without overlap (the smallest frequency of EEG signals was 0.1 Hz) [29]. The signal recording was performed in the Physiology Laboratory of Imam Reza International University (Mashhad City, Iran).
Feature extraction
In this research, we used a new method of nonlinear analysis based on phase space reconstruction to extract features, which is explained in the following sections.
Standard complementary plot
In the first step, we represent the time series in a suitable space. For this reason, we use a complementary plot that eliminates the effect of point amplitude and pays attention to its phase. To this end, we first normalized each segment (10 seconds of the time series) between -1 and 1. Then, we quantize the normalized processes to N levels. Finally, to construct the complement plot, we calculate the sine and cosine of each part of the quantized surface, and we connect the points with a hypothetical line. According to the research of Karimi et al. [29], by considering N=100, mandala-like patterns are created. Each part of the quantized surfaces is obtained by Equation 1 [29]
, Where S is a segment and Sq is a quantized segment. The sine and cosine of each part of the signal are calculated as follows by Equation 2.
Figure 3 shows the complementary plot of a segment of the brain and heart signal of a healthy person when hearing the sound of the Quran.
Circular cross-section
Then, to extract the feature, we match a circle with radius r (r=0.1, 0.2, 0.3, 0.4, 0.5, 0.6, 0.7, 0.8, 0.9, 1) on the standard complement plot and the vector of the number of points of intersection of the hypothetical lines of mandala patterns with a circular cross-section is obtained for different radii.
Fusion
A fusion technique that improves system performance has been used in this research. Fusion at the data level is performed on raw data, which is performed immediately after data collection from the sensor. If the input is a feature and the output is a feature, this process is called feature fusion or information fusion. And fusion at the decision level is obtained by combining the results of the decision of each data source. Feature fusion was obtained by combining the feature vectors of brain and heart signals, and the unit feature vector was given to the Classifier's input. To this effect, standard complementary plots of both brain and heart signals are drawn in one plot, and the sum of the intersection points of a circular section with radius r was calculated with the hypothetical lines of the standard complementary plots of brain and heart signals. Finally, the fused feature vector was obtained.
Classification
Our suggestion for classification is the support vector machine classifier. It is a supervised classification that distinguishes between two classes by an optimal hyper-plane with a maximum margin. SVM is one of the most commonly used classifiers in pattern recognition, biomedical studies, and neuroscience. In this work, the radial basis function (RBF) kernel has been used in SVM. In this research, we classify each pair of three signal recording modes, including B, WV, and WNV. Also, after applying the fusion, we gave the fused feature vector to the input of the SVM classifier and compared the results of the fusion classification with the previous step. The classifier’s performance was evaluated based on the calculation of sensitivity, specificity, and accuracy.
Results
In this step, after preprocessing the data and drawing the complementary plot, circles with different radii were drawn on the complementary plot, and the number of intersection points of the circle with the hypothetical lines was classified as feature vectors. We had three steps of signal recording using the SVM classifier, which was classified between two classes, and 9 different modes were created (Table 1).
The classification results of the different stages are reported below (Table 2).
To evaluate the classification performance by considering the feature fusion, the sum of the intersection points obtained from the circular intersection with radius r with a complement plot of heart and brain signals was stored in a feature vector and was given to the input of the SVM classifier. The classification results of the feature fusion are reported in Table 3.
According to the results (Tables 2 and 3), a maximum accuracy of 98.75% was achieved for C3 signals in B and WV classes. In addition, the best classification rate of 93.74% was obtained for C4 in the B and WNV classes. Also, the highest accuracy rate for ECG was 89.15% in B and WNV classes. Applying the proposed feature fusion methodology, the performances of the classifiers were improved significantly compared with considering each signal separately. The maximum state classification of 97.49% is attained feature fusion technique for C3 and ECG in B and WV classes. Regarding this technique, the highest classification accuracy was reached for the combination of C4 and ECG at 94.99% in B and WNV. Totally the lowest recognition rates were perceived by ECG signals separately. However, the lowest average accuracy value for ECG was 72.24% in B and WV classes, which increased to more than 90% when combined with any of the brain signals.
The specificity criterion, one of the evaluation criteria of the classifier, pays attention only to the true negative (TN). An ideal test has 100% specificity. Based on the specificity criterion, we conclude that the maximum average specificity is Mean±SD 94.32±1.97 for C3 in B and WV classes. The average specificity criterion for ECG was lower than that of EEG, which was improved by applying the fusion technique.
The sensitivity criterion, one of the evaluation criteria of the classifier, pays attention only to the true positive (TP). An ideal test has 100% sensitivity. Based on the sensitivity criterion, we conclude that the maximum average sensitivity WITH Mean±SD 2.06±2.26 for C3 in B and WV classes. The average sensitivity criterion for ECG was lower than that of EEG, which was improved by applying the fusion technique.
All the results reported above were the mean of the classification results in circles with radii of 0.1 to 1. If we look at it on a case-by-case basis, we will see that the best classification result is for C3 in the B and WV classes because by considering the intersection of complementary plots with circles with a radius of 0.2 to 1, the values of accuracy, specificity, and sensitivity were reported 100%. Finally, in all cases, the higher classification rates are identified by utilizing feature fusion. Generally, the results of fusion frameworks outperform the single signal-based approaches.
Discussion
In recent years, spirituality has played an influential role in human health. However, few studies have been done on the physiological effects of listening to the Quran. Some researchers have challenged this topic by employing different physiological signals, such as EEG and various methods. They usually examined brain signals isolated [5] or used one or more biosignals separately to assess unalike emotional states, even though there is an interaction between physiological systems [20]. Therefore, investigating fusion approaches by different physiological signals shows the interactive variation while improving the classifier’s performance.
This paper presented the effect of listening to the Holy Quran on the brain and heart signals simultaneously by examining different modes of signal recording and using a new feature fusion approach based on the phase space of the heart and brain signals. SVM has shown that the fusion method outperformed the EEG or ECG signals separately. Maximum accuracy of 98.75% was achieved by C3 for separating B and WV classes. The highest accuracy for ECG was 89.15% for discerning classes B and WNV. In general, the lowest classification was perceived by ECG signals separately. Using the proposed feature combination method, the performance of the classifiers was significantly improved compared to considering each signal alone. The maximum rate of 97.49% was obtained by fusing the C3 and ECG for discriminating between classes B and WV. Previously, the accuracy of the proposed system for listening to the Quran with a heart signal was 91.6% [30]. Goshvarpour et al. reported that the highest accuracy rate for detecting emotions caused by the sound of music was 81.82% for the GSR signal [25] a novel fusion framework based on wavelet transform (WT. Soroush et al. obtained 82% accuracy in classifying emotions through the phase space of the brain signal [19]. The fusion technique has been commonly used to improve system performance. In another paper, Goshvarpour et al., who combined HRV and variability PRV signals to detect emotions with the Poincaré plot method, reported 79.68% accuracy for feature-level fusion and 82.9% for decision-level fusion [15]. In another article [4] an approach is proposed for recognizing music-induced emotions through the fusion of three-channel forehead biosignals (the left temporalis, frontalis, and right temporalis channels, forehead biosignals and electrocardiograms were applied to detect emotions. The researchers used feature-level fusion, which resulted in 88.78% accuracy.
Conclusions
In this research, we investigated the effect of listening to the Holy Quran on the heart and brain signals of healthy participants. To this effect, we used a new approach to integrate the phase space of brain and heart signals. Moreover, by creating innovation in the way of data collection, including the simultaneous recording of heart and brain signals and investigating the innovative fusion technique, we took a step toward future research progress. The results showed a significant change in the brain signals of people while listening to the Quran (WV) compared to the state of silence (B) (maximum accuracy was 98.75% for C3). The highest difference was between the B state and the WNV state. Also, there was the least difference between WV and WNV, which shows that the effect of the sound of the Quran remains for a few moments after listening. The fusion technique has been effective in processing information and improving system performance. Our results, compared to other studies, confirmed the effectiveness of the fusion technique of physiological signals when listening to the Holy Quran.
Ethical Considerations
Compliance with ethical guidelines
All study procedures were done in compliance with the ethical guidelines of the 2013 Declaration of Helsinki. This article was approved by the Ethics Committee of Imam Reza International University (Ethical Code: IR.IMAMREZA.REC.1401.007).
Funding
This research did not receive any grant from funding agencies in the public, commercial, or non-profit sectors.
Authors contributions
Conceptualization and methodology, writing, review, and editing: All Authors; Investigation and writing the original draft: Roya Sheibani; Resources and supervision: Ghasem Sadeghi Bajestani and Ateke Goshvarpour.
Conflict of interest
The authors declared no conflict of interest.
Acknowledgements
The authors thank those who participated in this study.
References
- Esmaeili SM, Jaddadi M, Rafikhah M, Naqizadeh Z. [Investigating effectiveness of contemplating the Quran on mental health (Persian)]. Interdiscip Quranic Stud. 2016; 7(1):51-64. [Link]
- Naji M, Firoozabadi M, Azadfallah P. Emotion classification during music listening from forehead biosignals. Signal Image Video Process. 2015; 9(6):1365-75. [DOI:10.1007.s11760-013-0591-6]
- Momtahen M, Hajizadeh M. [Intonation and phonetic system of the Holy Quran (Persian). Quranic Stud Q. 2010; 1(4):173-90. [Link]
- Naji M, Firoozabadi M, Azadfallah P. Classification of music-induced emotions based on information fusion of forehead biosignals and electrocardiogram. Cognit Comput. 2014; 6(2):241-52. [DOI:10.1007.s12559-013-9239-7]
- Vaghefi M, Nasrabadi AM, Hashemi Golpayegani SMR, Mohammadi MR, Gharibzadeh S. Nonlinear analysis of electroencephalogram signals while listening to the Holy Quran. J Med Signals Sens. 2019; 9(2):100-10. [PMID] [PMCID]
- Cong F, Alluri V, Nandi AK, Toiviainen P, Fa R, Abu-Jamous B, et al. Linking brain responses to naturalistic music through analysis of ongoing EEG and stimulus features. IEEE Trans Multimed. 2013; 15(5):1060-9. [DOI:10.1109.TMM.2013.2253452]
- Goshvarpour A, Abbasi A, Goshvarpour A, Daneshvar S. Fusion framework for emotional electrocardiogram and galvanic skin response recognition: Applying wavelet transform. Iran J Med Phys. 2016; 13(3):163-73. [DOI:10.22038/IJMP.2016.7960]
- Naji M, Firoozabadi M, Azadfallah P. A new information fusion approach for recognition of music-induced emotions. IEEE-EMBS. Paper presented at: IEEE-EMBS International Conference on Biomedical and Health Informatics (BHI). 01-04 June 2014; Valencia, Spain. [DOI:10.1109.BHI.2014.6864340]
- Goshvarpour A, Abbasi A, Goshvarpour A. Dynamical analysis of emotional states from electroencephalogram signals. Biomed Eng Appl Basis Commun. 2016; 28(2):1-12.[DOI:10.4015.S1016237216500150]
- Qolizadeh A, Tayebi Myaneh Z, Rashvand F. Investigating the effect of listening to the Holy Quran on the physiological responses of neonates admitted to neonatal intensive care units: A pilot study. Adv Integr Med. 2018; 6(4):159-62. [DOI:10.1016.j.aimed.2018.08.004]
- Kamal NF, Mahmood NH, Zakaria NA. Modeling brain activities during reading working memory task: Comparison between reciting Quran and reading book. Procedia Soc Behav Sci. 2013; 97:83-9. [DOI:10.1016.j.sbspro.2013.10.207]
- Majidzadeh Ardabili K, Rostami R, Kazemi R. [Electrophysiological correlates of listening to the recitation of Quran (Persian). Shefaye Khatam. 2018; 6(2):69-81. [DOI:10.29252.shefa.6.2.69]
- Di GQ, Fan MC, Lin QH. An experimental study on EEG characteristics induced by intermittent pure tone stimuli at different frequencies. Appl Acoustics. 2018; 141:46-53.[DOI:10.1016.j.apacoust.2018.06.024]
- Shekatkar SM, Kotriwar Y, Harikrishnan KP, Ambika G. Detecting abnormality in heart dynamics from multifractal analysis of ECG signals. Sci Rep. 2017; 7(1):15127. [DOI:10.1038/s41598-017-15498-z] [PMID] [PMCID]
- Goshvarpour A, Abbasi A, Goshvarpour A. Fusion of heart rate variability and pulse rate variability for emotion recognition using lagged poincare plots. Australas Phys Eng Sci Med. 2017; 40(3):617-29. [DOI:10.1007.s13246-017-0571-1] [PMID]
- Ji N, Ma L, Dong H, Zhang X. EEG signals feature extraction based on DWT and EMD combined with approximate entropy. Brain Sci. 2019; 9(8):201. [DOI:10.3390.brainsci9080201] [PMID] [PMCID]
- Jiang Z, Guo C, Zang G, Lu G, Zhang D. Features fusion of multichannel wrist pulse signal based on KL-MGDCCA and decision level combination. Biomed Signal Process Control. 2020; 57:101751. [DOI:10.1016.j.bspc.2019.101751]
- García-Martínez B, Martinez-Rodrigo A, Alcaraz R, Fernández-Caballero A. A review on nonlinear methods using electroencephalographic recordings for emotion recognition. IEEE Trans. Affect Comput. 2019; 12(3):801-20. [DOI:10.1109.TAFFC.2018.2890636]
- Zangeneh Soroush M, Maghooli K, Setarehdan SK, Motie Nasrabadi A. A novel EEG-based approach to classify emotions through phase space dynamics. Signal, Image Video Process. 2019; 13(6):1149-56. [DOI:10.1007.s11760-019-01455-y]
- Ruiz-Padial E, Ibáñez-Molina AJ. Fractal dimension of EEG signals and heart dynamics in discrete emotional states. Biol Psychol. 2018; 137:42-8. [DOI:10.1016.j.biopsycho.2018.06.008] [PMID]
- Jacob JE, Nair GK, Cherian A, Iype T. Application of fractal dimension for EEG based diagnosis of encephalopathy. Analog Integr. Circuits Signal Process. 2019; 100(2):429-36. [DOI:10.1007.s10470-019-01388-z]
- Čukić M, Stokić M, Radenković S, Ljubisavljević M, Simić S, Savić D. Nonlinear analysis of EEG complexity in episode and remission phase of recurrent depression. Int J Methods Psychiatr Res. 2020; 29(2):e1816. [DOI:10.1002.mpr.1816] [PMID] [PMCID]
- Sabeti M, Katebi S, Boostani R. Entropy and complexity measures for EEG signal classification of schizophrenic and control participants. Artif Intell Med. 2009; 47(3):263-74. [DOI:10.1016.j.artmed.2009.03.003] [PMID]
- Goshvarpour A, Abbasi A, Goshvarpour A. Indices from lagged poincare plots of heart rate variability: An efficient nonlinear tool for emotion discrimination. Australas Phys Eng Sci Med. 2017; 40(2):277-87. [DOI:10.1007.s13246-017-0530-x] [PMID]
- Goshvarpour A, Abbasi A, Goshvarpour A, Daneshvar S. A novel signal-based fusion approach for accurate music emotion recognition. Biomedical Engineering. Appl Basis Commun. 2016; 28(06):1650040. [DOI:10.4015.S101623721650040X]
- Rashinkar P, Krushnasamy VS. An overview of data fusion techniques. Paper resented at: 2017 International Conference on Innovative Mechanisms for Industry Applications (ICIMIA). 21-23 February 2017; Bengaluru, India. [DOI:10.1109.ICIMIA.2017.7975553]
- Hall DL, McMullen SA. Mathematical techniques in multisensor data fusion. Boston: Artech House; 2004. [Link]
- Koelstra S, Patras I. Fusion of facial expressions and EEG for implicit affective tagging. Image Vision Comput. 2013; 31(2):164-74. [DOI:10.1016.j.imavis.2012.10.002]
- Yaghoobi Karimui R, Azadi S, Keshavarzi P. The ADHD effect on the actions obtained from the EEG signals. Biocybern Biomed Eng. 2018; 38(2):425-37. [DOI:10.1016.j.bbe.2018.02.007]
- Naqvi SZ, Aziz S, Tariq MH, Khan MU, Aslam HA, Imtiaz MA. Effect of Al-Quran recitation on human physiology. Paper preseted at: 2020 International Conference on Electrical, Communication, and Computer Engineering (ICECCE). 12-13 June 2020; Istanbul, Turkey. [DOI:10.1109.ICECCE49384.2020.9179455]
Type of Study: Research |
Subject:
Special
Received: 2023/03/28 | Accepted: 2023/01/11 | Published: 2023/04/23
Received: 2023/03/28 | Accepted: 2023/01/11 | Published: 2023/04/23
| Rights and permissions | |
 | This work is licensed under a Creative Commons Attribution-NonCommercial 4.0 International License. |
Articles Copyright © The Author(s).
Owned by Guilan University of Medical Sciences.
Co-published by Negah Institute for Scientific Communication.
Contact Information
Caspian Journal of Neurological Sciences
Guilan University of Medical Sciences
University Tel : +9813 3333 0939
E-mail: cjnsgums@gmail.com, cjns@gums.ac.ir
Owned by Guilan University of Medical Sciences.
Co-published by Negah Institute for Scientific Communication.
Contact Information
Caspian Journal of Neurological Sciences
Guilan University of Medical Sciences
University Tel : +9813 3333 0939
E-mail: cjnsgums@gmail.com, cjns@gums.ac.ir