Sat, Apr 27, 2024
Volume 7, Issue 2 (Spring 2021)
Caspian J Neurol Sci 2021, 7(2): 74-83 |
Back to browse issues page


Download citation:
BibTeX | RIS | EndNote | Medlars | ProCite | Reference Manager | RefWorks
Send citation to:


BibTeX | RIS | EndNote | Medlars | ProCite | Reference Manager | RefWorks
Send citation to:
Sadeghian F, Hasani H, Jafari M. Feature Selection Based on Genetic Algorithm in the Diagnosis of Autism Disorder by fMRI. Caspian J Neurol Sci 2021; 7 (2) :74-83
URL: http://cjns.gums.ac.ir/article-1-416-en.html
URL: http://cjns.gums.ac.ir/article-1-416-en.html


1- Department of Geodesy and Suryeing Engineering, Tafresh University, Tafresh, Iran.
Full-Text [PDF 1817 kb]
(1338 Downloads)
| Abstract (HTML) (1887 Views)
Full-Text: (644 Views)
Introduction
utism Spectrum Disorder (ASD) was introduced in 1943 by Leo Caner, a psychiatrist in the United States. This disorder is a clinical diagnosis based on a spectrum of neurological diseases, including autism, Asperger syndrome, and Rett syndrome leading to a persistent defect in a person’s verbal, visual, auditory, touch skills, and social behavior [2, 1]. Due to the progressive increase in ASD in recent years, as well as the lack of its definitive treatment, much research has been done on brain mapping to compare Functional Connectivity (FC) and brain function of autistic and healthy people. Therefore, datasets from the extensive connections regions of the brain are collected [3].
Magnetic Resonance Imaging (MRI), as a non-invasive technique, has been widely used to study brain regional networks. Thus, MRI data can be used to display variations in neural networks, which can help in identifying biomarkers for ASD. MRI scans are further divided into structural MRI (sMRI) and functional MRI (fMRI), according to the type of scanning technique. To understand the basic causes and find treatments, we used functional magnetic resonance imaging leading to potential biomarkers of the disease.
Functional magnetic resonance imaging is an efficient technique for mapping brain activity (task state or rest state) by Blood-Oxygen-Level-Dependent (BOLD) that presented by Seiji Ogawa [4]. Therefore, by studying changes in the brain using fMRI image processing and accurately extracting the pattern of abnormalities in early ages of life, it can be benefited as a reliable method for early diagnosis of autism [5]. For example, functional connectivity computed from resting-state functional MRI (rs-fMRI) has been used to derive features for ASD classification with classical machine learning approaches. With the appearance of fMRI images, the first studies to identify autism disease have been performed by checking the shape and volume of different brain regions. In 1999, Ring et al. using fMRI images in the task state concluded that several brain regions were similarly activated in the two groups. The difference was that the prefrontal cortical regions, were more active in the healthy group [6]. Despite current limitations, the potential of autism biomarker research is enormous. Many studies have been devoted to the role of genetic and biomarkers such as disabilities in speech, behavior, and learning in identifying ASD [7].
In recent years, researchers’ investigations in the diagnosis of mental diseases such as autism, epilepsy, schizophrenia, etc., are based on the study of functional connections between different regions of the brain. Recognition of the structure and function of brain networks firstly requires understanding the connection of brain regions with each other. The data analysis based on time-series and functional connectivity matrix, including activity patterns between different regions, is done by determining the correlation between the time signals of the brain image voxels [8]. In this section, various methods addressing the recognition and the structure of brain networks and classification data are discussed.
In 2004, Just et al. found that functional connectivity in brain networks decreased in people with autism [9]. Zanganeh et al. proposed a dimension reduction method using the combination of Artificial Neural Network (ANN) classification algorithm and Genetic Algorithm (GA) for disease (like breast caser, thyroid disease [hypothyroid] diagnosis) [10]. In 2011, Boehm et al. analyzed fMRI image data for identifying cognitive brain functions. In this study, they used the GA and one-class learning method to extract appropriate features and classify visual cognitive tasks [11]. Plitt et al. used the various classification algorithms to detect ASD rs-fMRI, including Random Forest (RF), K-Nearest Neighbor (KNN), Linear Support Vector Machines (L-SVM), Gaussian kernel Support Vector Machines (rbf-SVM), L1-regularized logistic regression, L2-regularized logistic regression, elastic-net-regularized logistic regression, Gaussian Naive Bayes, and linear discriminant analysis. Specifically, regions identified in this study as most predictive of ASD included the insula, ventromedial prefrontal cortex, anterior, middle, and posterior regions of cingulate cortex, supplementary motor cortex, anterior temporal lobes, posterior aspects of the fusiform gyrus, posterior superior temporal sulcus, temporal-parietal junction, intraparietal sulcus, and inferior and middle frontal gyri bilaterally [12]. Chen et al. investigated atypical connections between the default mode network, frontoparietal network, and cingulo-opercular network that may eventually be used to aid the detection of ASD. They applied an SVM classifier and achieved an accuracy of 79.17%, sensitivity of 77.78%, and specificity of 80.47% [13]. Beheshti et al. diagnosed mild cognitive disorders in the brain of people with Alzheimer using fMRI images. Input data are classified by SVM, and a GA is applied to find the optimal feature subset. The results of the proposed method showed that the proposed method could differentiate between patients with stable Mild Cognitive Impairment (sMCI) and individuals with progressive Mild Cognitive Impairment (pMCI) [14]. Sen et al. derived a novel algorithm for combining MRI and fMRI data features which can then be used to differentiate healthy people and patients. They used the SVM classifier and achieved an accuracy of 64.3% [15]. Eslami et al. presented the Auto-ASD-Network method to combine deep learning methods and support vector machines for diagnosing ASD and reduce the number of features using fMRI data. This study helps in quantifying the current psychiatric diagnosis and can increase the accuracy of diagnosis, prognosis, and treatments to assess mental disorders such as Attention Deficit Hyperactivity Disorder (ADHD) and ASD [16].
One of the main challenges in fMRI analysis is the high-dimension of data. Although Functional Connectivity Matrix (FCM) data provides comprehensive information about communication between different brain regions, the high dimensions of the feature-space impose several challenges in the classification and analysis stage. Therefore, feature selection is considered one of the most critical issues in distinguishing autistic from healthy people. The purposes of feature selection are dimension reduction, increasing the speed of operations, increasing the accuracy of classification algorithms, and better understanding the results.
In studies, various data classifiers and accuracy assessment models have been used to quickly and accurately diagnose the status of ASD and its symptoms. Regarding the recent research in this field, little attention has also been paid to the dimension reduction of FCM. Selecting the appropriate regions to generate FCM leads to increasing classification accuracy. It is an NP-hard problem due to the high dimensions of the search space. In this paper, for the first step, the pre-processing is performed on rs-fMRI images. In the next step, it is divided into 116 regions using automated anatomical labeling of the brain, and the Pearson correlation coefficient is computed for every pair of the 116 brain regions to create a time series of brain activity vectors. Then, the K-Nearest Neighbor (KNN) classifier is used to identify the two groups of autism and healthy. Finally, a genetic algorithm as a meta-heuristic method and a powerful search engine is applied to choose the optimal regions for dimension reduction of the search space. Generally, meta-heuristic search algorithms are inspired by biological processes in nature, and most of them operate as a population. GA is also a branch of evolutionary algorithms whose fundamental principles are adapted from the science of genetics and was introduced in 1975 by John H. Holland [17].
Materials and Methods
Study materials
To evaluate the capability of the proposed method in this analytical study, fMRI images are used in the Autism Brain Imaging Data Exchange (ABIDE) represents data from 17 international sites, including 820 samples where 375 people have ASD, and the rest are healthy, approved by [18]. This research dataset includes sMRI and rs-fMRI, scanned from ASD and healthy groups with information such as age, sex, IQ, etc. (Table 1).
.jpg)
Methodology
To prepare data for the process, fMRI images are registered, and they are pre-processed using the FMRIB Software Library (FSL) software package. The pre-processing steps are 1) slice timing correction, 2) spatial realignment, 3) distortion correction, 4) normalization, 5) spatial smoothing, and 6) temporal filtering [19].
Then the feature space is generated based on the FCM, and finally, GA is used to find the appropriate features. The flowchart of the proposed method is shown in Figure 1.
.jpg) Feature extraction based on functional connectivity
Feature extraction based on functional connectivity
By creating a functional connections map of the brain, the function and correlation of time series are determined between different brain regions. Brain FCM is determined based on correlation coefficients between regions [20, 21, 22]. In this study, automated anatomical labeling, which divides the human brain into 116 regions, has been used [23].
For each region, by averaging the BOLD signal time-series of the voxels of that region in the pre-processed image, a time series is extracted for that region. The FC between 116 brain regions is determined using the Pearson correlation coefficient. It determines the degree of linear correlation between time series of different regions. The value of this coefficient, which is between 1 and -1, determines the power of FC between different brain regions. If there is a high correlation between the two regions, its value will be 1, if two time series are not correlated, it will be 0, and if the time series of the two regions has been completely inverted, it will be -1. The Pearson correlation coefficient is calculated according to Equation 1.
.jpg)
, where n is the number of images obtained from the whole brain. The values of xi (t) and xj (t) are respectively the values of the time-series in the two regions i and j at time t. Also, x̅i and x̅j are the averages of the time-series in these two regions.
Dimension reduction based on genetic algorithm
Although FC provides complete information about how different brain regions communicate, its high-dimensional feature space imposes several challenges in the classification and analysis stage. Therefore, feature selection is one of the crucial issues in distinguishing autistic persons from healthy ones. GA, as a meta-heuristic optimization algorithm, considers a set of feature subsets in each iteration and can effectively find an optimal or near-optimal feature subset.
In general, dimension reduction of the data is made using the components of a GA that include chromosome coding, selection, crossover, and mutation. Each chromosome represents an array of numbers 0, 1, that is, the total number of features (length 116×1) in the search space (Figure 2).
.jpg) The values of 0 and 1 present the absence and presence of the corresponding region in the FCM calculation, respectively.
The values of 0 and 1 present the absence and presence of the corresponding region in the FCM calculation, respectively.
A series of random solutions (initial population) is created, and then the quality of the solutions is evaluated based on the fitness function. The accuracy of the KNN classifier based on selected regions is considered as the fitness function. The roulette wheel selection is applied to select parents. For this purpose, the probability of selection corresponding to each chromosome is calculated based on Equation 2.
.jpg)
, where, F(hi) is the fitness value for the solution hi and p is the size of the population.
The crossover is performed on a pair of parents based on a single-point operator. After generating a member in a new population, some genes are mutated randomly, which provides availability to search all feature space and escape from the local optimal solution. Finally, the GA ends according to the number of iteration repetitions, and the solution with the highest classification accuracy will determine the final feature subset.
To evaluate the solution, the KNN classifier’s accuracy is used. Cover et al. introduced this algorithm in 1968 [24]. The KNN classification algorithm is one of the most common supervised classification techniques used for predicting the class of a sample with an unspecified class based on the class of its neighbor samples. The algorithm is made of three steps:
1. Calculating the distance of the unknown sample from all training samples,
2. Arranging training samples based on the distance and selection of K-nearest neighbors,
3. Using the class that is major among the KNN, i.e., this method considers a class of unknown samples observed more than all the other classes among the KNNs.
Generally, for predicting a new class, the algorithm looks for similar samples among a set of the training dataset. Therefore, if the samples have n attributes, they will be considered as a vector in n-dimensional space to predict the class label of a new record based on a distance criterion such as the Euclidean distance in this space as well as the class label of the neighbors. The classifier assumes the distance of samples from each other as a criterion for their closeness to select the most similar samples. There are numerous methods to compute the distance, among which the function of Euclidean distance is one of the most common ones defined as Equation 3.
.jpg)
, where the parameters xi and yi are two samples, and m is the number of features.
Also, when there is a combination of numerical and batch variables in the data set, the issue of standardization of numerical variables between 0 and 1 is raised. It is best to select the optimal value for K by initial inspecting the data. One of the most critical parameters in the KNN algorithm is the K value; in fact, there is no accurate value for K, and its proper amount depends on the data distribution and space of the problem.
After training the classifier with the data, the testing data are used to evaluate the function of the classifier. In this study, classification accuracy has been used as an objective function Equation 4.
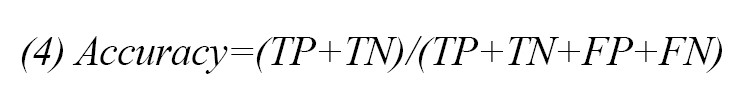
, where TP (true positive) is the number of persons with autism whose classification algorithm correctly diagnose patient. FP (false positive) is the number of healthy persons who misdiagnose with autism. TN (true negative) is the number of healthy persons who correctly diagnose as healthy, and FN (false negative) is the number of autistic persons who misdiagnose as healthy.
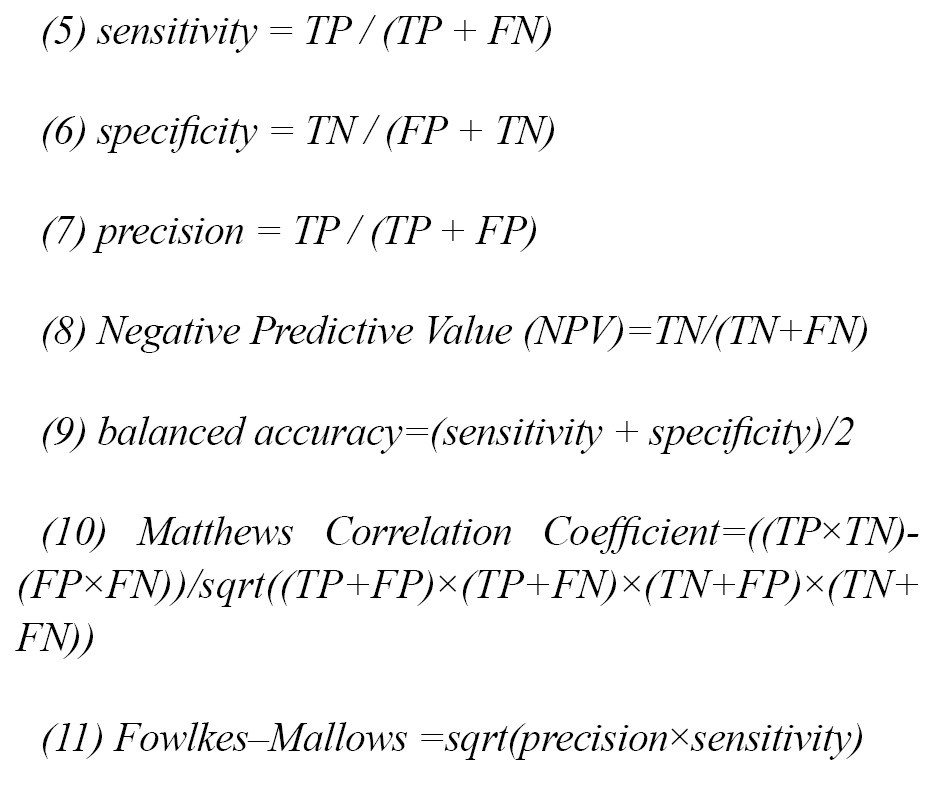
To evaluate the results and performance of the classification algorithm, other parameters of the confusion matrix table have been used, which are as Equation 5, 6, 7, 8, 9, 10, and 11:
Results
To evaluate the proposed method, ABIDE autism database is used, which consists of 820 pre-processed 3D images of the brain. Data are divided into training, testing, and validation randomly: 60% of the samples are selected as training data, 20% as testing data, and 20% as validation data to evaluate the classifier.
By considering 116 regions and 6670 features based on FCM, the accuracy for test and validation data of the KNN classifier are 51.82% and 55.48%, respectively. Then, the GA and KNN classifiers are combined to select a subset of the optimal region subset for ASD identification. The GA parameters are given in Table 2.
.jpg)
Dimension reduction using GA and KNN classifier removed 47 redundant regions, and 67 regions have remained. The convergence diagram of a GA is shown in Figure 3, displaying the best value of the fitness function in each iteration.
.jpg) Tables 3 and 4 show the classification results of the obtained properties as test and validation data using the KNN classification algorithm and the optimally selected properties with the proposed GA.
Tables 3 and 4 show the classification results of the obtained properties as test and validation data using the KNN classification algorithm and the optimally selected properties with the proposed GA.
.jpg)
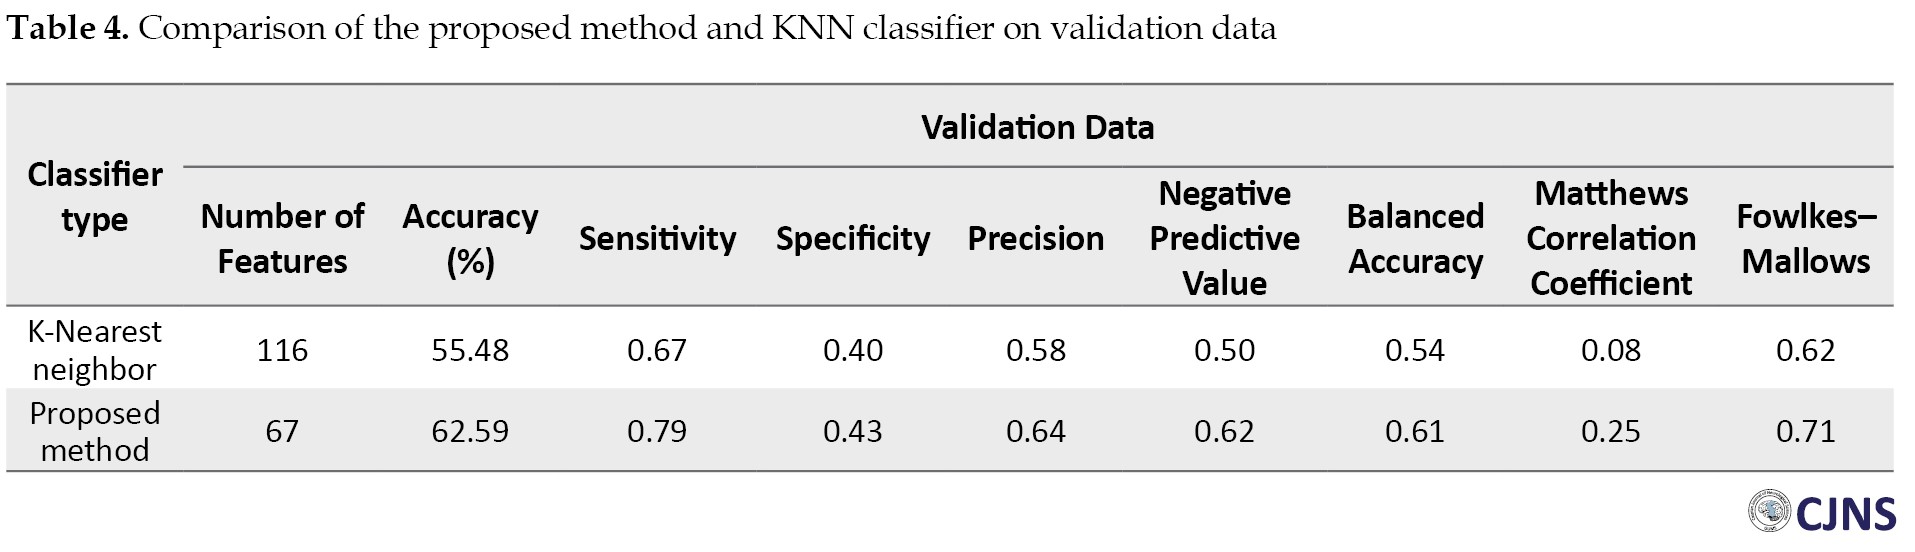
Based on the obtained results, the GA algorithm can increase the classification accuracy to 10% on the test data and 7% on the validation data. Using anatomical atlas and genetic algorithm, a significant difference is obtained between the two groups of healthy and autistic people, which leads to the selection of 67 areas out of 116 features. Selected anatomical regions are shown in Table 5.
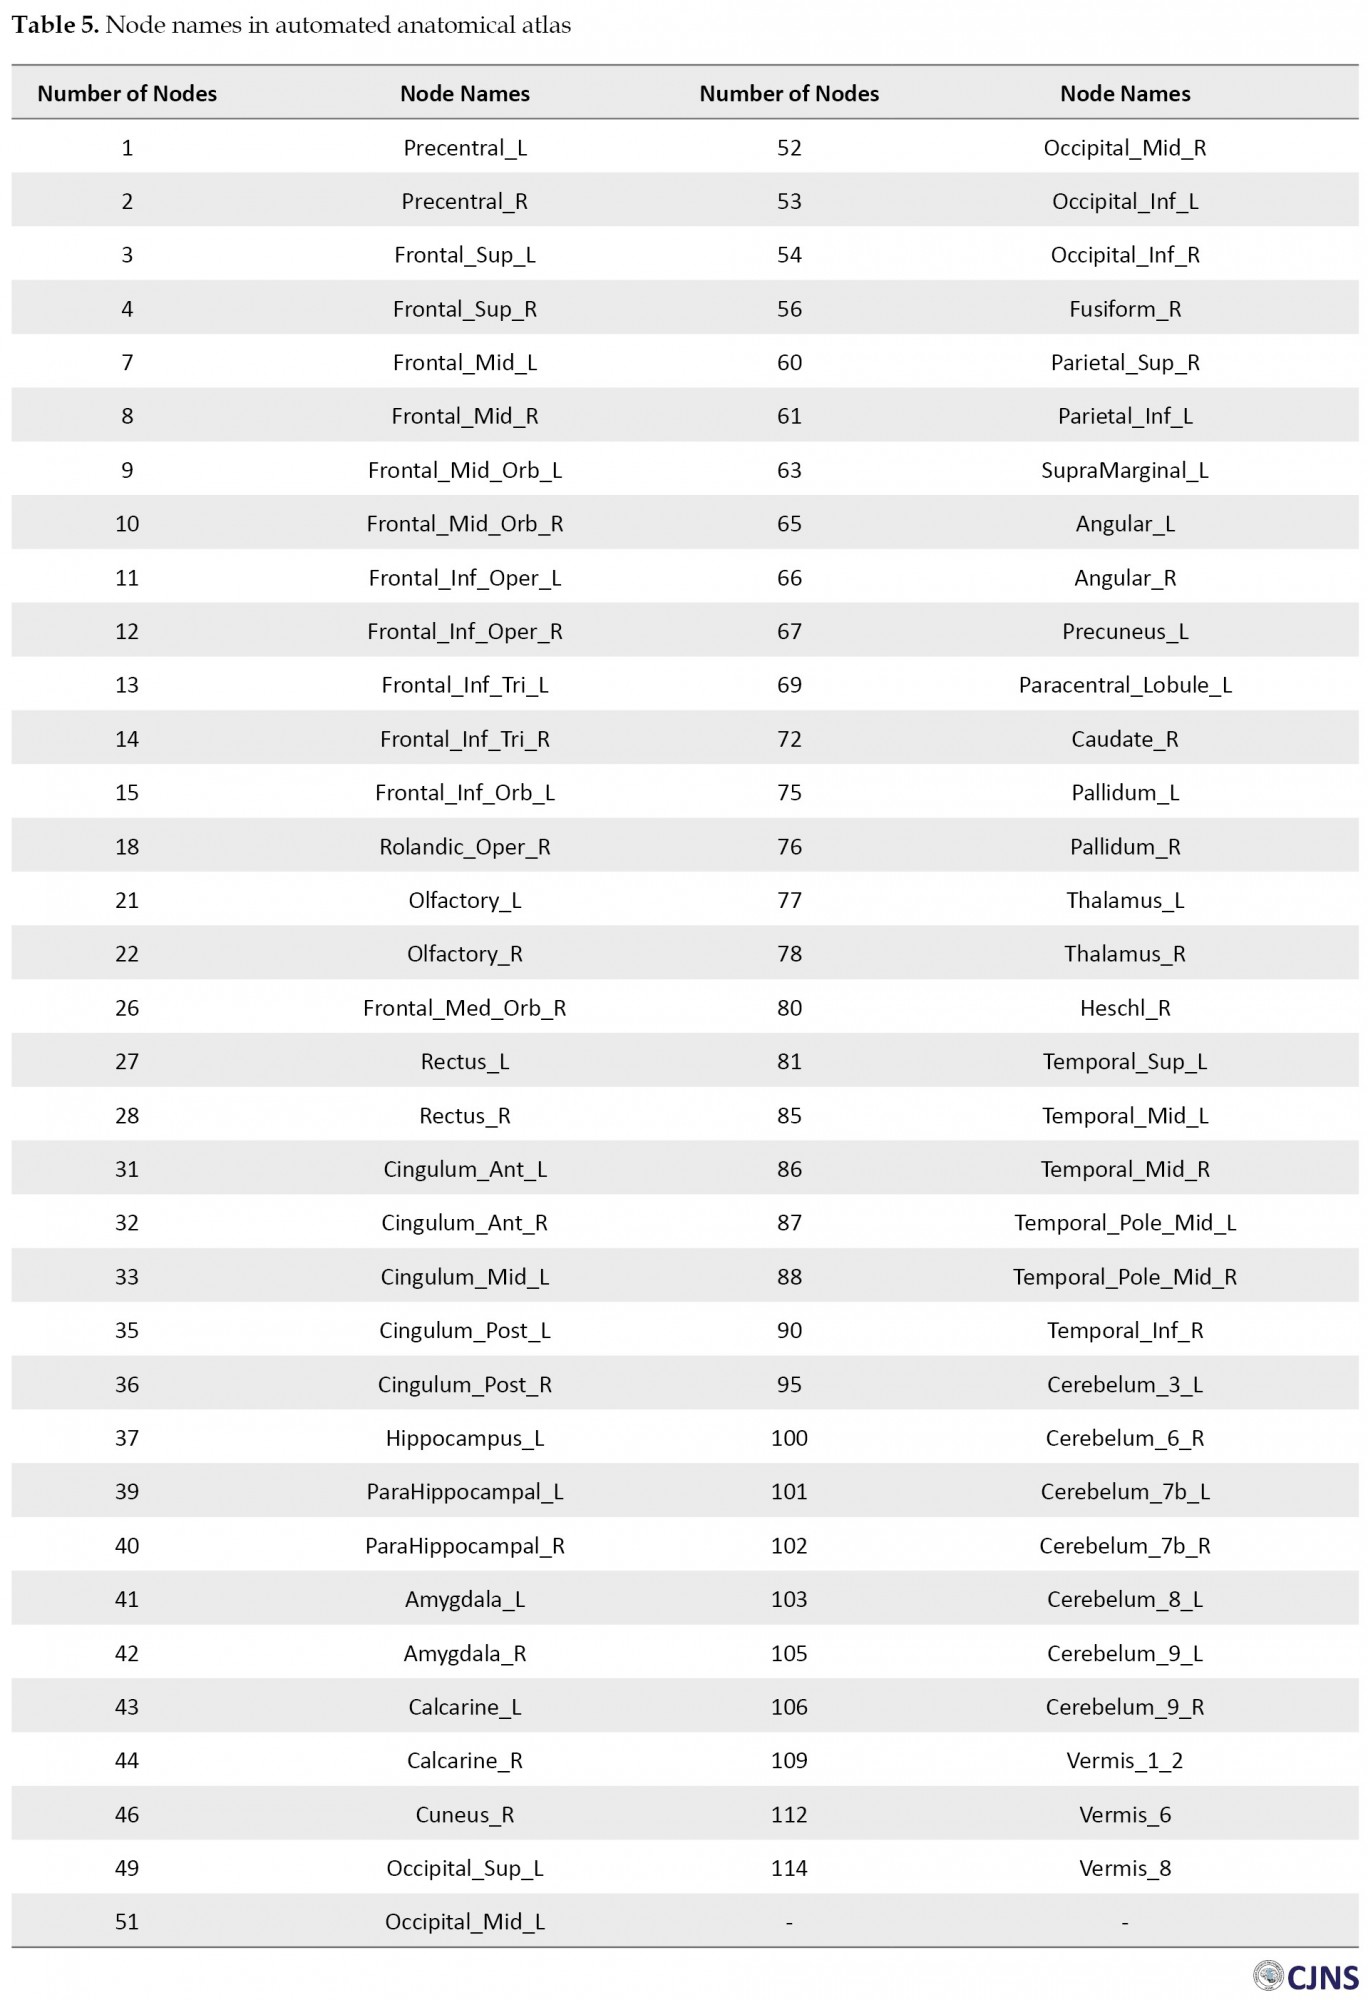
Comparing functional network criteria between the two healthy and autistic groups showed that 67 areas in the functional network at resting-state have an abnormal pattern, and there is a significant difference in the brain function of patients.
Discussion
In this study, an optimization method for diagnosing autism using fMRI images was presented. In recent years, due to the advance in medical data acquisition technology, improvement in medical image processing methods are required.
High-dimensional feature space with correlated and redundant features encounter diagnosing autism problem with some challenges. To resolve these issues, the use of supervised classification algorithms such as KNN and GA as a meta-heuristic algorithm was proposed for dimension reduction. It increases the accuracy of distinguishing autistic and healthy groups based on fMRI images.
The classification results using selected regions on test and validation data are 61.08% and 62.59%, respectively. In summary, the proposed method results have more quality in terms of accuracy, specificity, and sensitivity, indicating the high capability of the method.
With the progress of medical science, researchers in this field are faced with a large-data from different sources. Regarding the extensive use of meta-heuristic algorithms and their efficiency in dimension reduction of data, it is suggested to use other meta-heuristic algorithms in this field and compare the optimal features extracted from them. Also, they can be used to diagnose other brain disorders such as epilepsy, Alzheimer, Parkinson, etc.
Conclusion
In this study, a machine learning algorithm is applied in the Diagnosis of autism disorder. For this purpose, functional connectivity is extracted from fMRI images. Then, effective regions in the brain are selected based on a genetic algorithm as a robust metaheuristic optimization algorithm. For quality determination, a KNN classifier is implemented. The obtained results prove that the proposed method is a well-designed system and can effectively differentiate between autistic and healthy people. It increases the accuracy, specificity, and sensitivity of distinguishing autistic and healthy people based on fMRI images.
Ethical Considerations
Compliance with ethical guidelines
All study procedures were done in compliance with the ethical guidelines of the 2013 Declaration of Helsinki.
Funding
This research received no specific grant from funding agencies in the public, commercial, or non-profit sectors.
Authors' contributions
Conceptualization: Farzaneh Sadeghian, Hadiseh Hasani; Methodology: Hadiseh Hasani; Investigation, writing the original draft, review, and editing: All authors; Resource: Farzaneh Sadeghian; Supervision: Hadiseh Hasani, Marzieh Jafari.
Conflict of interest
The authors declared no conflict of interest.
References
utism Spectrum Disorder (ASD) was introduced in 1943 by Leo Caner, a psychiatrist in the United States. This disorder is a clinical diagnosis based on a spectrum of neurological diseases, including autism, Asperger syndrome, and Rett syndrome leading to a persistent defect in a person’s verbal, visual, auditory, touch skills, and social behavior [2, 1]. Due to the progressive increase in ASD in recent years, as well as the lack of its definitive treatment, much research has been done on brain mapping to compare Functional Connectivity (FC) and brain function of autistic and healthy people. Therefore, datasets from the extensive connections regions of the brain are collected [3].
Magnetic Resonance Imaging (MRI), as a non-invasive technique, has been widely used to study brain regional networks. Thus, MRI data can be used to display variations in neural networks, which can help in identifying biomarkers for ASD. MRI scans are further divided into structural MRI (sMRI) and functional MRI (fMRI), according to the type of scanning technique. To understand the basic causes and find treatments, we used functional magnetic resonance imaging leading to potential biomarkers of the disease.
Functional magnetic resonance imaging is an efficient technique for mapping brain activity (task state or rest state) by Blood-Oxygen-Level-Dependent (BOLD) that presented by Seiji Ogawa [4]. Therefore, by studying changes in the brain using fMRI image processing and accurately extracting the pattern of abnormalities in early ages of life, it can be benefited as a reliable method for early diagnosis of autism [5]. For example, functional connectivity computed from resting-state functional MRI (rs-fMRI) has been used to derive features for ASD classification with classical machine learning approaches. With the appearance of fMRI images, the first studies to identify autism disease have been performed by checking the shape and volume of different brain regions. In 1999, Ring et al. using fMRI images in the task state concluded that several brain regions were similarly activated in the two groups. The difference was that the prefrontal cortical regions, were more active in the healthy group [6]. Despite current limitations, the potential of autism biomarker research is enormous. Many studies have been devoted to the role of genetic and biomarkers such as disabilities in speech, behavior, and learning in identifying ASD [7].
In recent years, researchers’ investigations in the diagnosis of mental diseases such as autism, epilepsy, schizophrenia, etc., are based on the study of functional connections between different regions of the brain. Recognition of the structure and function of brain networks firstly requires understanding the connection of brain regions with each other. The data analysis based on time-series and functional connectivity matrix, including activity patterns between different regions, is done by determining the correlation between the time signals of the brain image voxels [8]. In this section, various methods addressing the recognition and the structure of brain networks and classification data are discussed.
In 2004, Just et al. found that functional connectivity in brain networks decreased in people with autism [9]. Zanganeh et al. proposed a dimension reduction method using the combination of Artificial Neural Network (ANN) classification algorithm and Genetic Algorithm (GA) for disease (like breast caser, thyroid disease [hypothyroid] diagnosis) [10]. In 2011, Boehm et al. analyzed fMRI image data for identifying cognitive brain functions. In this study, they used the GA and one-class learning method to extract appropriate features and classify visual cognitive tasks [11]. Plitt et al. used the various classification algorithms to detect ASD rs-fMRI, including Random Forest (RF), K-Nearest Neighbor (KNN), Linear Support Vector Machines (L-SVM), Gaussian kernel Support Vector Machines (rbf-SVM), L1-regularized logistic regression, L2-regularized logistic regression, elastic-net-regularized logistic regression, Gaussian Naive Bayes, and linear discriminant analysis. Specifically, regions identified in this study as most predictive of ASD included the insula, ventromedial prefrontal cortex, anterior, middle, and posterior regions of cingulate cortex, supplementary motor cortex, anterior temporal lobes, posterior aspects of the fusiform gyrus, posterior superior temporal sulcus, temporal-parietal junction, intraparietal sulcus, and inferior and middle frontal gyri bilaterally [12]. Chen et al. investigated atypical connections between the default mode network, frontoparietal network, and cingulo-opercular network that may eventually be used to aid the detection of ASD. They applied an SVM classifier and achieved an accuracy of 79.17%, sensitivity of 77.78%, and specificity of 80.47% [13]. Beheshti et al. diagnosed mild cognitive disorders in the brain of people with Alzheimer using fMRI images. Input data are classified by SVM, and a GA is applied to find the optimal feature subset. The results of the proposed method showed that the proposed method could differentiate between patients with stable Mild Cognitive Impairment (sMCI) and individuals with progressive Mild Cognitive Impairment (pMCI) [14]. Sen et al. derived a novel algorithm for combining MRI and fMRI data features which can then be used to differentiate healthy people and patients. They used the SVM classifier and achieved an accuracy of 64.3% [15]. Eslami et al. presented the Auto-ASD-Network method to combine deep learning methods and support vector machines for diagnosing ASD and reduce the number of features using fMRI data. This study helps in quantifying the current psychiatric diagnosis and can increase the accuracy of diagnosis, prognosis, and treatments to assess mental disorders such as Attention Deficit Hyperactivity Disorder (ADHD) and ASD [16].
One of the main challenges in fMRI analysis is the high-dimension of data. Although Functional Connectivity Matrix (FCM) data provides comprehensive information about communication between different brain regions, the high dimensions of the feature-space impose several challenges in the classification and analysis stage. Therefore, feature selection is considered one of the most critical issues in distinguishing autistic from healthy people. The purposes of feature selection are dimension reduction, increasing the speed of operations, increasing the accuracy of classification algorithms, and better understanding the results.
In studies, various data classifiers and accuracy assessment models have been used to quickly and accurately diagnose the status of ASD and its symptoms. Regarding the recent research in this field, little attention has also been paid to the dimension reduction of FCM. Selecting the appropriate regions to generate FCM leads to increasing classification accuracy. It is an NP-hard problem due to the high dimensions of the search space. In this paper, for the first step, the pre-processing is performed on rs-fMRI images. In the next step, it is divided into 116 regions using automated anatomical labeling of the brain, and the Pearson correlation coefficient is computed for every pair of the 116 brain regions to create a time series of brain activity vectors. Then, the K-Nearest Neighbor (KNN) classifier is used to identify the two groups of autism and healthy. Finally, a genetic algorithm as a meta-heuristic method and a powerful search engine is applied to choose the optimal regions for dimension reduction of the search space. Generally, meta-heuristic search algorithms are inspired by biological processes in nature, and most of them operate as a population. GA is also a branch of evolutionary algorithms whose fundamental principles are adapted from the science of genetics and was introduced in 1975 by John H. Holland [17].
Materials and Methods
Study materials
To evaluate the capability of the proposed method in this analytical study, fMRI images are used in the Autism Brain Imaging Data Exchange (ABIDE) represents data from 17 international sites, including 820 samples where 375 people have ASD, and the rest are healthy, approved by [18]. This research dataset includes sMRI and rs-fMRI, scanned from ASD and healthy groups with information such as age, sex, IQ, etc. (Table 1).
Methodology
To prepare data for the process, fMRI images are registered, and they are pre-processed using the FMRIB Software Library (FSL) software package. The pre-processing steps are 1) slice timing correction, 2) spatial realignment, 3) distortion correction, 4) normalization, 5) spatial smoothing, and 6) temporal filtering [19].
Then the feature space is generated based on the FCM, and finally, GA is used to find the appropriate features. The flowchart of the proposed method is shown in Figure 1.
By creating a functional connections map of the brain, the function and correlation of time series are determined between different brain regions. Brain FCM is determined based on correlation coefficients between regions [20, 21, 22]. In this study, automated anatomical labeling, which divides the human brain into 116 regions, has been used [23].
For each region, by averaging the BOLD signal time-series of the voxels of that region in the pre-processed image, a time series is extracted for that region. The FC between 116 brain regions is determined using the Pearson correlation coefficient. It determines the degree of linear correlation between time series of different regions. The value of this coefficient, which is between 1 and -1, determines the power of FC between different brain regions. If there is a high correlation between the two regions, its value will be 1, if two time series are not correlated, it will be 0, and if the time series of the two regions has been completely inverted, it will be -1. The Pearson correlation coefficient is calculated according to Equation 1.
, where n is the number of images obtained from the whole brain. The values of xi (t) and xj (t) are respectively the values of the time-series in the two regions i and j at time t. Also, x̅i and x̅j are the averages of the time-series in these two regions.
Dimension reduction based on genetic algorithm
Although FC provides complete information about how different brain regions communicate, its high-dimensional feature space imposes several challenges in the classification and analysis stage. Therefore, feature selection is one of the crucial issues in distinguishing autistic persons from healthy ones. GA, as a meta-heuristic optimization algorithm, considers a set of feature subsets in each iteration and can effectively find an optimal or near-optimal feature subset.
In general, dimension reduction of the data is made using the components of a GA that include chromosome coding, selection, crossover, and mutation. Each chromosome represents an array of numbers 0, 1, that is, the total number of features (length 116×1) in the search space (Figure 2).
A series of random solutions (initial population) is created, and then the quality of the solutions is evaluated based on the fitness function. The accuracy of the KNN classifier based on selected regions is considered as the fitness function. The roulette wheel selection is applied to select parents. For this purpose, the probability of selection corresponding to each chromosome is calculated based on Equation 2.
, where, F(hi) is the fitness value for the solution hi and p is the size of the population.
The crossover is performed on a pair of parents based on a single-point operator. After generating a member in a new population, some genes are mutated randomly, which provides availability to search all feature space and escape from the local optimal solution. Finally, the GA ends according to the number of iteration repetitions, and the solution with the highest classification accuracy will determine the final feature subset.
To evaluate the solution, the KNN classifier’s accuracy is used. Cover et al. introduced this algorithm in 1968 [24]. The KNN classification algorithm is one of the most common supervised classification techniques used for predicting the class of a sample with an unspecified class based on the class of its neighbor samples. The algorithm is made of three steps:
1. Calculating the distance of the unknown sample from all training samples,
2. Arranging training samples based on the distance and selection of K-nearest neighbors,
3. Using the class that is major among the KNN, i.e., this method considers a class of unknown samples observed more than all the other classes among the KNNs.
Generally, for predicting a new class, the algorithm looks for similar samples among a set of the training dataset. Therefore, if the samples have n attributes, they will be considered as a vector in n-dimensional space to predict the class label of a new record based on a distance criterion such as the Euclidean distance in this space as well as the class label of the neighbors. The classifier assumes the distance of samples from each other as a criterion for their closeness to select the most similar samples. There are numerous methods to compute the distance, among which the function of Euclidean distance is one of the most common ones defined as Equation 3.
, where the parameters xi and yi are two samples, and m is the number of features.
Also, when there is a combination of numerical and batch variables in the data set, the issue of standardization of numerical variables between 0 and 1 is raised. It is best to select the optimal value for K by initial inspecting the data. One of the most critical parameters in the KNN algorithm is the K value; in fact, there is no accurate value for K, and its proper amount depends on the data distribution and space of the problem.
After training the classifier with the data, the testing data are used to evaluate the function of the classifier. In this study, classification accuracy has been used as an objective function Equation 4.
, where TP (true positive) is the number of persons with autism whose classification algorithm correctly diagnose patient. FP (false positive) is the number of healthy persons who misdiagnose with autism. TN (true negative) is the number of healthy persons who correctly diagnose as healthy, and FN (false negative) is the number of autistic persons who misdiagnose as healthy.
To evaluate the results and performance of the classification algorithm, other parameters of the confusion matrix table have been used, which are as Equation 5, 6, 7, 8, 9, 10, and 11:
Results
To evaluate the proposed method, ABIDE autism database is used, which consists of 820 pre-processed 3D images of the brain. Data are divided into training, testing, and validation randomly: 60% of the samples are selected as training data, 20% as testing data, and 20% as validation data to evaluate the classifier.
By considering 116 regions and 6670 features based on FCM, the accuracy for test and validation data of the KNN classifier are 51.82% and 55.48%, respectively. Then, the GA and KNN classifiers are combined to select a subset of the optimal region subset for ASD identification. The GA parameters are given in Table 2.
Dimension reduction using GA and KNN classifier removed 47 redundant regions, and 67 regions have remained. The convergence diagram of a GA is shown in Figure 3, displaying the best value of the fitness function in each iteration.
Based on the obtained results, the GA algorithm can increase the classification accuracy to 10% on the test data and 7% on the validation data. Using anatomical atlas and genetic algorithm, a significant difference is obtained between the two groups of healthy and autistic people, which leads to the selection of 67 areas out of 116 features. Selected anatomical regions are shown in Table 5.
Comparing functional network criteria between the two healthy and autistic groups showed that 67 areas in the functional network at resting-state have an abnormal pattern, and there is a significant difference in the brain function of patients.
Discussion
In this study, an optimization method for diagnosing autism using fMRI images was presented. In recent years, due to the advance in medical data acquisition technology, improvement in medical image processing methods are required.
High-dimensional feature space with correlated and redundant features encounter diagnosing autism problem with some challenges. To resolve these issues, the use of supervised classification algorithms such as KNN and GA as a meta-heuristic algorithm was proposed for dimension reduction. It increases the accuracy of distinguishing autistic and healthy groups based on fMRI images.
The classification results using selected regions on test and validation data are 61.08% and 62.59%, respectively. In summary, the proposed method results have more quality in terms of accuracy, specificity, and sensitivity, indicating the high capability of the method.
With the progress of medical science, researchers in this field are faced with a large-data from different sources. Regarding the extensive use of meta-heuristic algorithms and their efficiency in dimension reduction of data, it is suggested to use other meta-heuristic algorithms in this field and compare the optimal features extracted from them. Also, they can be used to diagnose other brain disorders such as epilepsy, Alzheimer, Parkinson, etc.
Conclusion
In this study, a machine learning algorithm is applied in the Diagnosis of autism disorder. For this purpose, functional connectivity is extracted from fMRI images. Then, effective regions in the brain are selected based on a genetic algorithm as a robust metaheuristic optimization algorithm. For quality determination, a KNN classifier is implemented. The obtained results prove that the proposed method is a well-designed system and can effectively differentiate between autistic and healthy people. It increases the accuracy, specificity, and sensitivity of distinguishing autistic and healthy people based on fMRI images.
Ethical Considerations
Compliance with ethical guidelines
All study procedures were done in compliance with the ethical guidelines of the 2013 Declaration of Helsinki.
Funding
This research received no specific grant from funding agencies in the public, commercial, or non-profit sectors.
Authors' contributions
Conceptualization: Farzaneh Sadeghian, Hadiseh Hasani; Methodology: Hadiseh Hasani; Investigation, writing the original draft, review, and editing: All authors; Resource: Farzaneh Sadeghian; Supervision: Hadiseh Hasani, Marzieh Jafari.
Conflict of interest
The authors declared no conflict of interest.
References
- Ghaffari MA, Mousavinejad E, Riahi F, Mousavinejad M, Afsharmanesh MR. Increased serum levels of tumor necrosis factor-alpha, resistin, and visfatin in the children with autism spectrum disorders: A case-control study. Neurol Res Int. 2016; 2016:9060751. [DOI:10.1155/2016/9060751] [PMID] [PMCID]
- Beversdorf DQ. Phenotyping, etiological factors, and biomarkers: Toward precision medicine in autism spectrum disorders. J Dev Behav Pediatr. 2016; 37(8):659–73. [DOI:10.1097/DBP.0000000000000351] [PMID] [PMCID]
- Daniel R, Margulies DS, Haueis P. From regions to networks: Neuroimaging approaches to mapping brain organization. Amsterdam: Elsevier Inc; 2019. [DOI:10.1016/B978-0-12-816179-1.00023-2]
- Ogawa S, Lee TM. Magnetic resonance imaging of blood vessels at high fields: In vivo and in vitro measurements and image simulation. Magn Reson Med. 1990; 16(1):9-18. [DOI:10.1002/mrm.1910160103] [PMID]
- Nasser IM, Al-Shawwa MO, Abu-Naser SS. Artificial neural network for diagnose autism spectrum disorder. Int J Academic Inf Syst Res (IJAISR). 2019; 3(2):27-32. https://www.researchgate.net/publication/331398314_Artificial_Neural_Network_for_Diagnose_Autism_Spectrum_Disorder
- Ring HA, Baron-Cohen S, Wheelwright S, Williams SCR, Brammer M, Andrew C, et al. Cerebral correlates of preserved cognitive skills in autism a functional MRI study of embedded figures task performance. Brain. 1999; 122(7):1305-15. [DOI:10.1093/brain/122.7.1305] [PMID]
- Ruggeri B, Sarkans U, Schumann G, Persico AM. Biomarkers in autism spectrumdisorder: The old and the new. Psychopharma. 2013; 231(6):1201-16. [DOI:10.1007/s00213-013-3290-7] [PMID]
- Friston KJ. Functional and effective connectivity in neuroimaging: A synthesis. Hum Brain Mapp. 1994; 2(1-2):56–78. [DOI:10.1002/hbm.460020107]
- Just MA, Cherkassky VL, Keller TA, Minshew NJ. Cortical activation and synchronization during sentence comprehension in high-functioning autism: Evidence of underconnectivity. Brain. 2004; 127(8):1811-21. [DOI:10.1093/brain/awh199] [PMID]
- Zanganeh S, Javanmard R, Ebadzadeh MM. A hybrid approach for features dimension reduction of data sets using hybrid algorithm artificial neural network and genetic algorithm-in medical diagnosis. Paprt presented at: 3rd Data Mining Conference. 15-16 December 2009; Iran, Tehran. https://civilica.com/doc/108982/
- Boehm OR, Hardoon DM, Manevitz L. Classifying cognitive states of brain activity via one-class neural networks with feature selection by genetic algorithms. Int J Mach Learn Cyber. 2011; 2(3):125-34. [DOI:10.1007/s13042-011-0030-3]
- Plitt M, Barnes KA, Martin A. Functional connectivity classification of autism identifies highly predictive brain features but falls short of biomarker standards. Neuroimage Clin. 2015; 7:359–66. [DOI:10.1016/j.nicl.2014.12.013] [PMID] [PMCID]
- Chen H, Duan X, Liu F, Lu F, Ma X, Zhang Y, et al. Multivariate classification of autism spectrum disorder using frequency-specific resting-state functional connectivity: A multi-center study. Prog Neuropsychopharmacol Biol Psychiatry. 2016; 64:1-9. [DOI:10.1016/j.pnpbp.2015.06.014] [PMID]
- Beheshti I, Demirel H, Matsuda H. Classification of alzheimer’s disease and prediction of mild cognitive impairment-to-alzheimer’s conversion from structural magnetic resource imaging using feature ranking and a genetic algorithm. Comput Bio Med. 2017; 83:109-19. [DOI:10.1016/j.compbiomed.2017.02.011] [PMID]
- Sen B, Borle CN, Greiner R, RG Brown M. A general prediction model for the detection of ADHD and autism using structural and functional MRI. PLoS One. 2018; 13:1-21. [DIO:10.1371/journal.pone.0194856] [PMID] [PMCID]
- Eslami T, Raiker JS, Saeed F. Explainable and scalable machine-learnig algorithms for detection of autism spectrum disorder using fMRI data. Neur Cog. 2020. https://arxiv.org/abs/2003.01541
- Holland JH. Adaptation in natural and artificial systems: An introductory analysis with applications to biology, control, and artificial intelligence. Cambridge, MA: MIT Press. 1975. https://libgen.is/book/index.php?md5=8D766EBD68AD9070E382315C8FFEE47B&tlm=2016-04-03%2009:51:08
- NYU Langone Health. Child Study Center [Internet]. 2021 [Updated 2021]. Available from: http: //fcon1000.projects.nitrc.org/indi/abide
- Frackowiak R, Ashburner J, Penny W, Zeki S. Human brain function. Amsterdam: Elsevier Academic Press; 2004. https://www.google.com/books/edition/Human_Brain_Function/Ze1CnwEACAAJ?hl=en
- Lang EW, Tomé AM, Keck IR, Górriz-Sáez JM, Puntonet CG. Brain connectivity analysis: A short survey. Comput Intell Neurosci. 2012; 2012:412512. [DIO: 10.1155/2012/412512] [PMID] [PMCID]
- Just MA, Cherkassky VL, Keller TAK, Kana RK, Minshew NJ. Functional and anatomical cortical underconnectivity in autism: Evidence from an fMRI study of an executive function task and corpus callosum morphometry. Cereb Cortex. 2007; 17(4):951-61. [DIO:10.1093/cercor/bhl006] [PMID] [PMCID]
- Hull JV, Dokovna LB, Jacokes ZJ, Torgerson CM, Irimia A, Van Horn JD. Resting-state functional connectivity in autism spectrum disorders: A review. Front Psychiatry. 2017; 7:1-17. [DIO: 10.3389/fpsyt.2016.00205] [PMID] [PMCID]
- Tzourio-Mazoyer N, Landeau B, Papathanassiou D, Crivello F, Etard O, Delcroix N, et al. Automated anatomical labeling of activations in SPM using a macroscopic anatomical parcellation of the MNI MRI single-subject brain. Neuroimage. 2002; 15(1):273-89. [DIO:10.1006/nimg.2001.0978] [PMID]
- Cover T, Hart P. Nearest neighbor pattern classification. IEEE Trans Inf Theory. 1967; 13(1):21-7. sci-hub.se/10.1109/TIT.1967.1053964
Type of Study: Research |
Subject:
Special
Received: 2021/07/1 | Accepted: 2021/04/30 | Published: 2021/04/30
Received: 2021/07/1 | Accepted: 2021/04/30 | Published: 2021/04/30
| Rights and permissions | |
 | This work is licensed under a Creative Commons Attribution-NonCommercial 4.0 International License. |
Articles Copyright © The Author(s).
Owned by Guilan University of Medical Sciences.
Co-published by Negah Institute for Scientific Communication.
Contact Information
Caspian Journal of Neurological Sciences
Guilan University of Medical Sciences
University Tel : +9813 3333 0939
E-mail: cjnsgums@gmail.com, cjns@gums.ac.ir
Owned by Guilan University of Medical Sciences.
Co-published by Negah Institute for Scientific Communication.
Contact Information
Caspian Journal of Neurological Sciences
Guilan University of Medical Sciences
University Tel : +9813 3333 0939
E-mail: cjnsgums@gmail.com, cjns@gums.ac.ir